Process.Science for ITSM

Your next step towards modern IT service management (ITSM)

Process.Science Service Management Multi Hop Dashboard in Power BI
Process.Science Service Management Rework Dashboard in Power BI
Process.Science Service Management Detailed Dashboard in Power BI
Process.Science Service Management Lead Times Dashboard in Power BI
Process.Science Service Management Case Viewer Dashboard in Power BI
Process.Science Service Management Benchmark Dashboard in Power BI
Introduction
In a world where SLA targets, resource constraints, and process inefficiencies are part of everyday life, IT teams need more than just traditional tools. Process.Science for ITSM addresses modern challenges with real-time analytics, automation, and complete transparency across your entire toolchain.
Process.Science Service Management Multi Hop Dashboard in Power BI

What is Process.Science for ITSM?

Process.Science for ITSM is a platform for in-depth analysis of ITSM processes, designed to uncover optimization potential, automate workflows, and reliably meet SLA requirements. The solution provides targeted support for your IT process optimization.

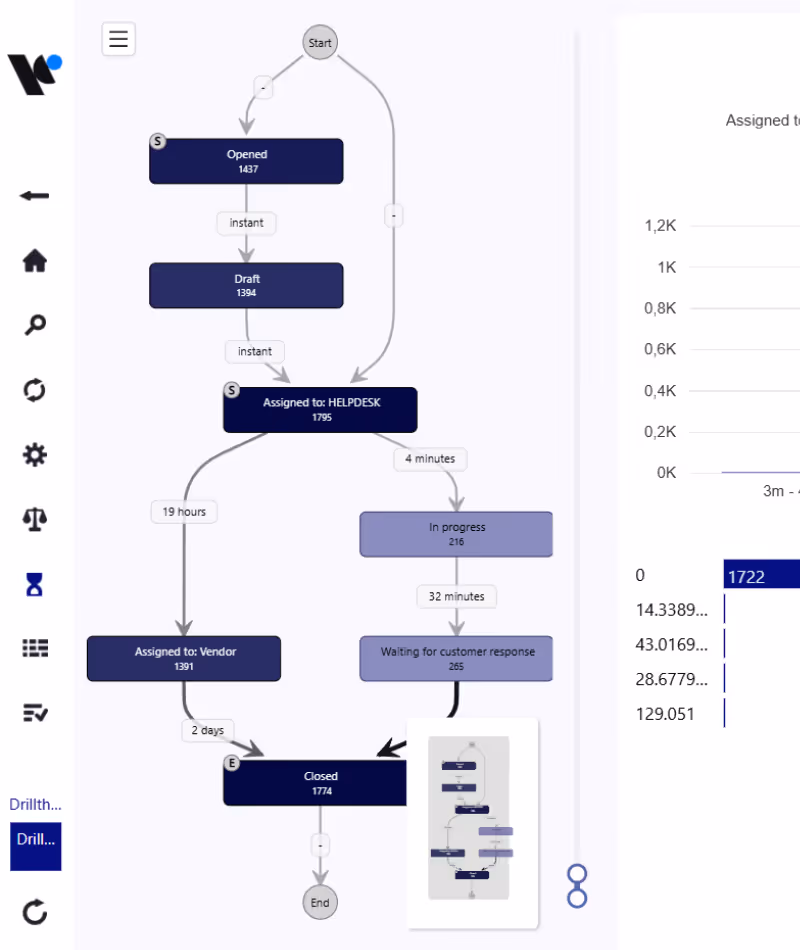
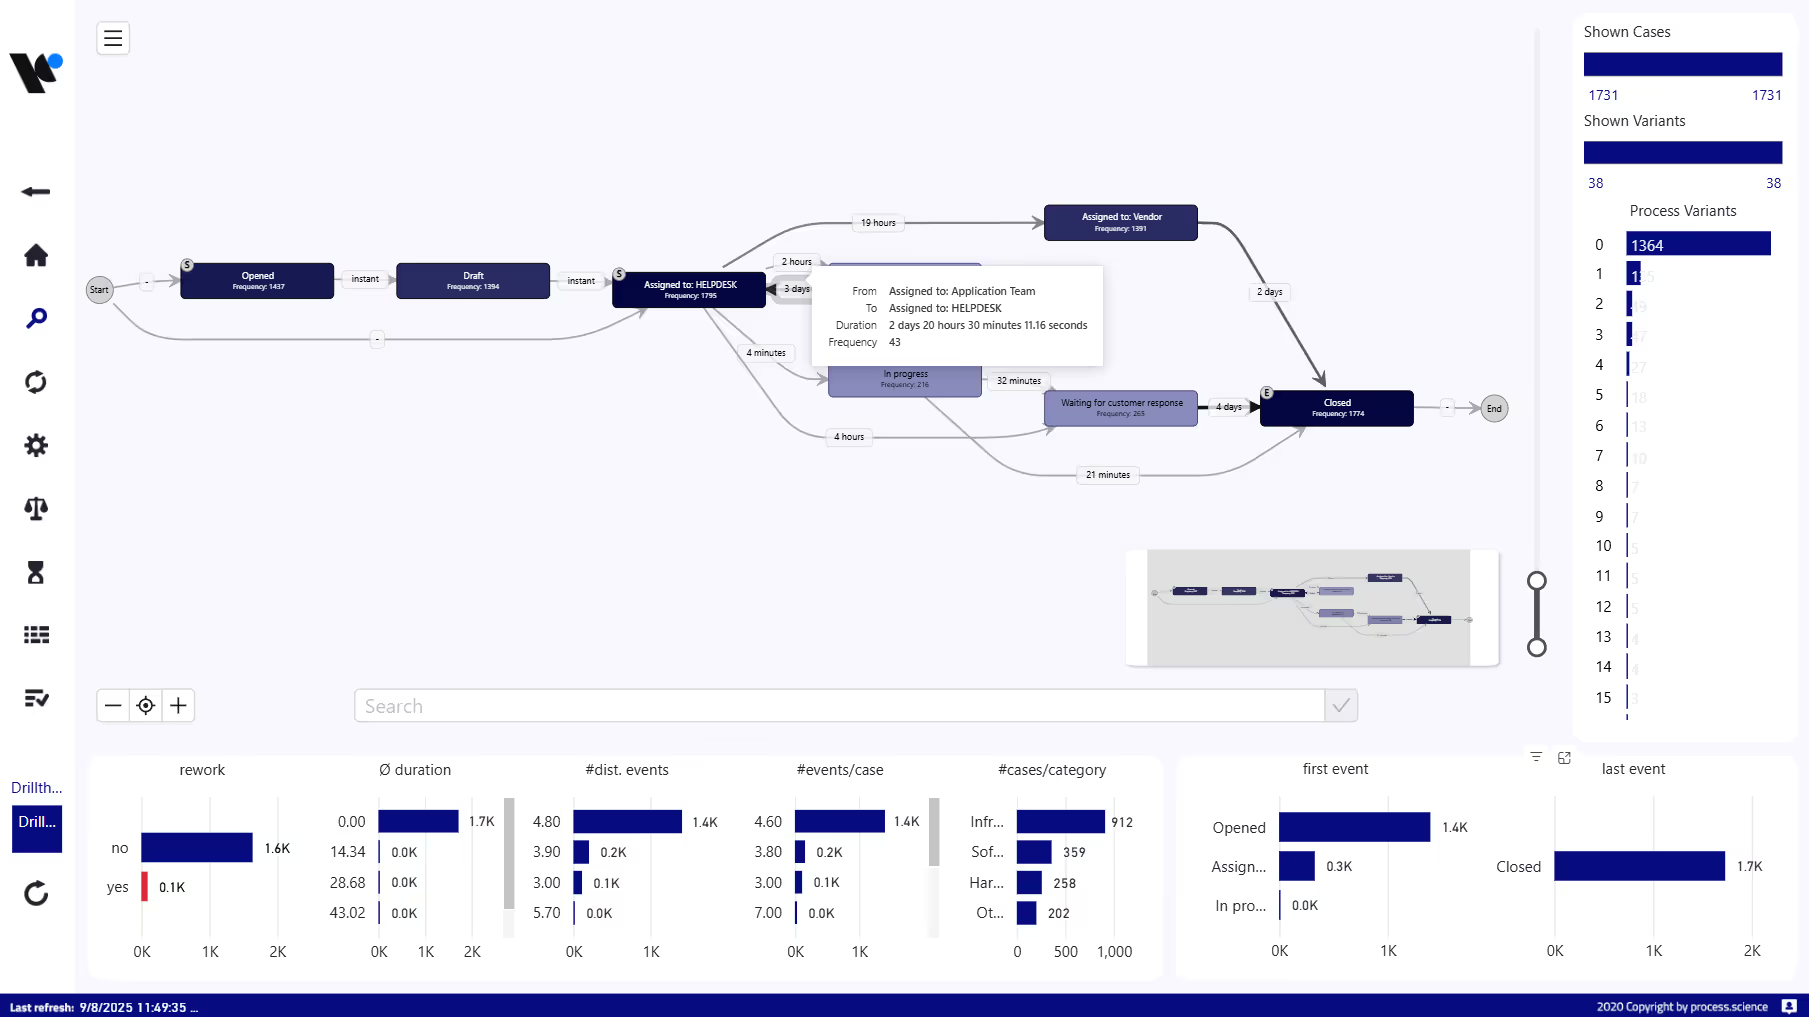
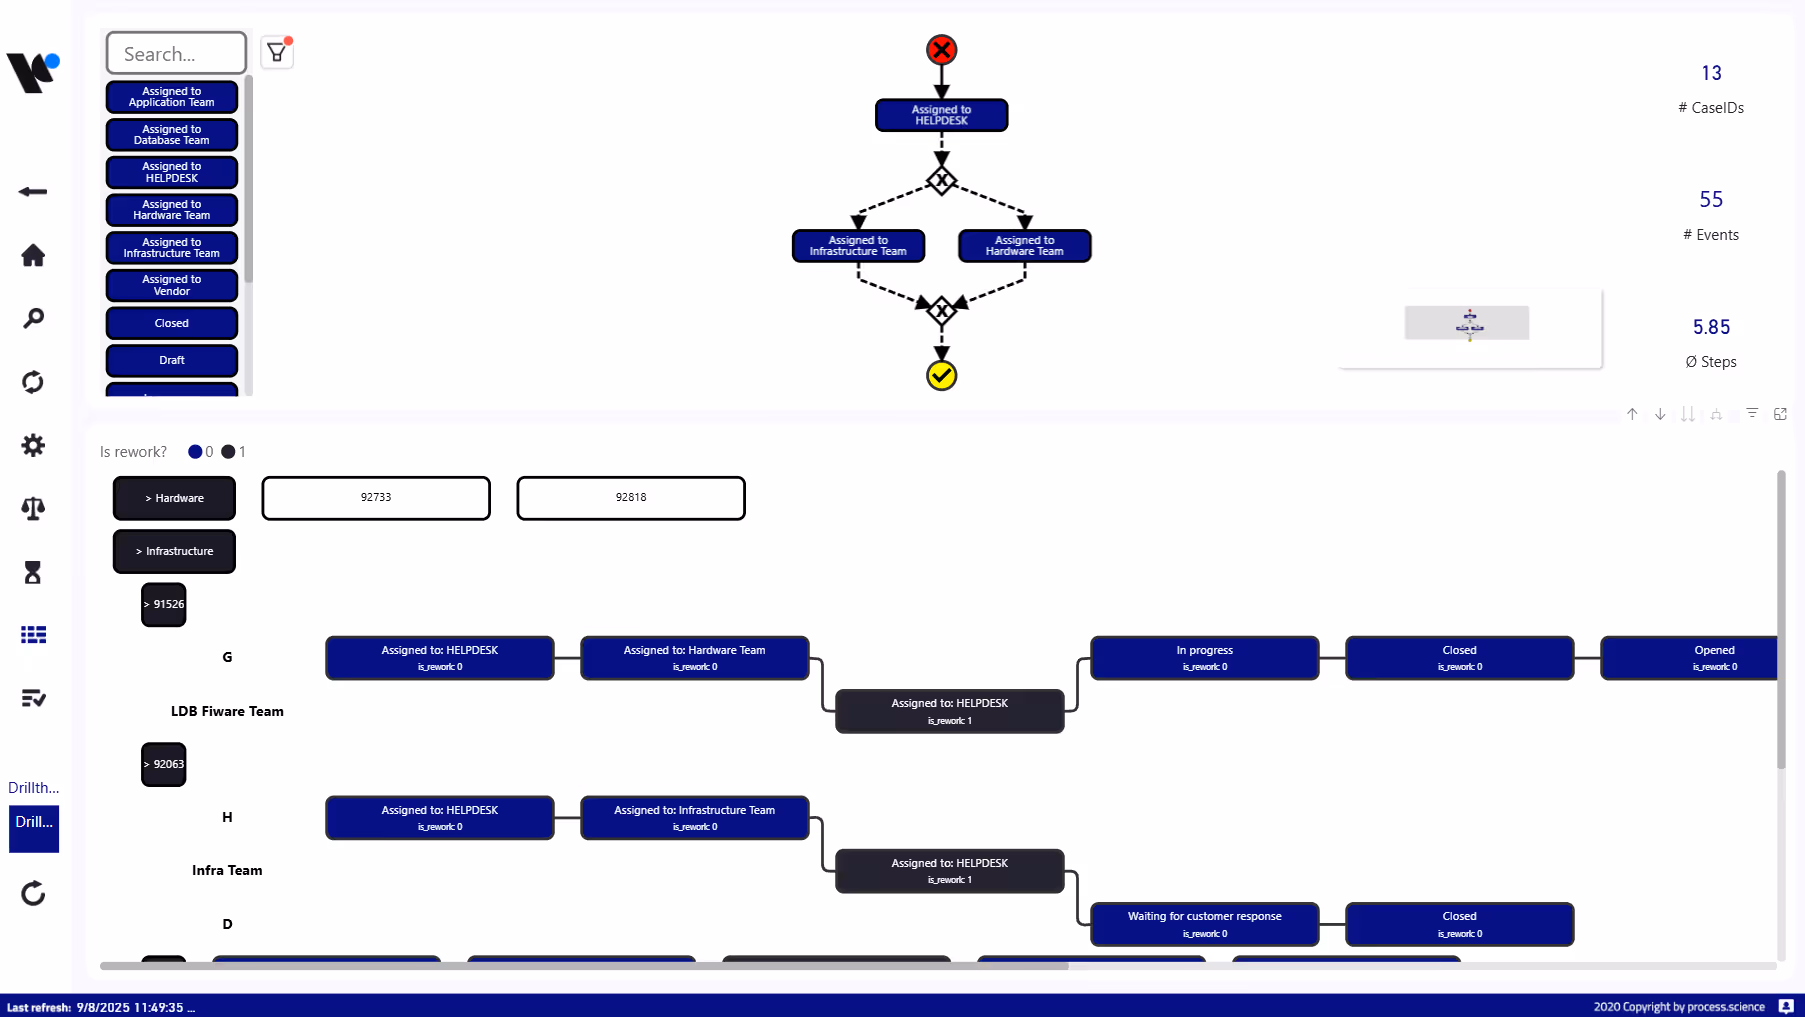
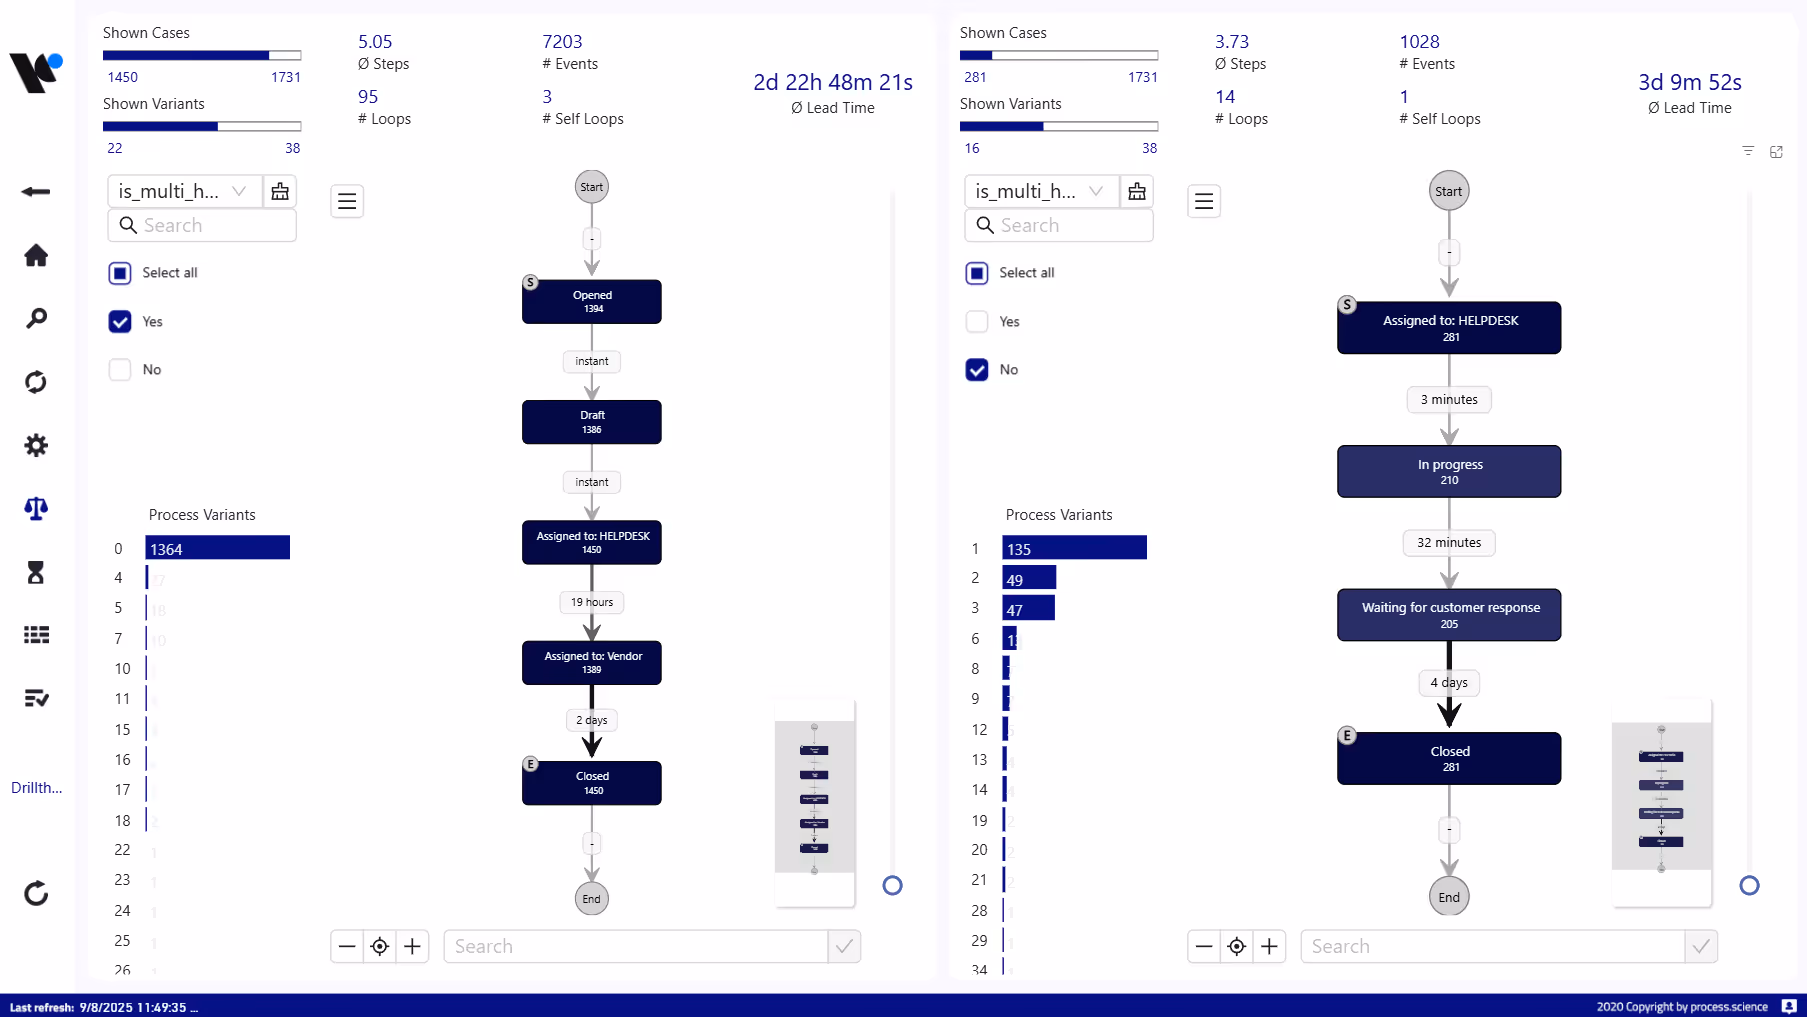
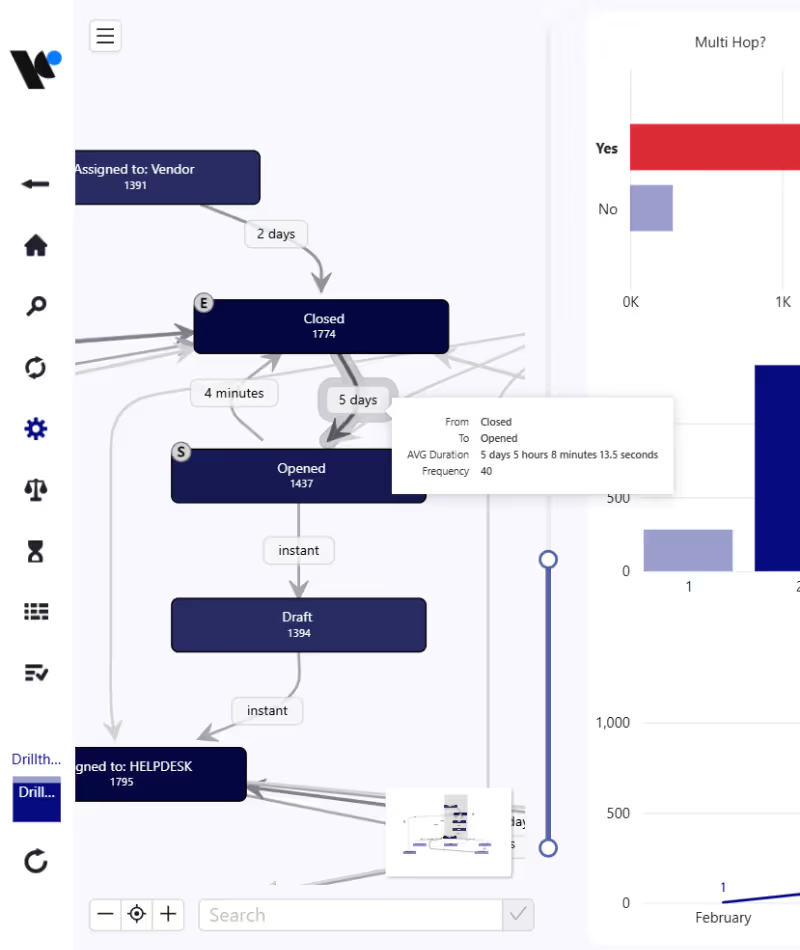
By applying process mining to tools such as Jira, Azure DevOps, and ServiceNow, it not only analyzes tickets but also visualizes the entire lifecycle of your service processes.

The solution goes far beyond classic dashboards:

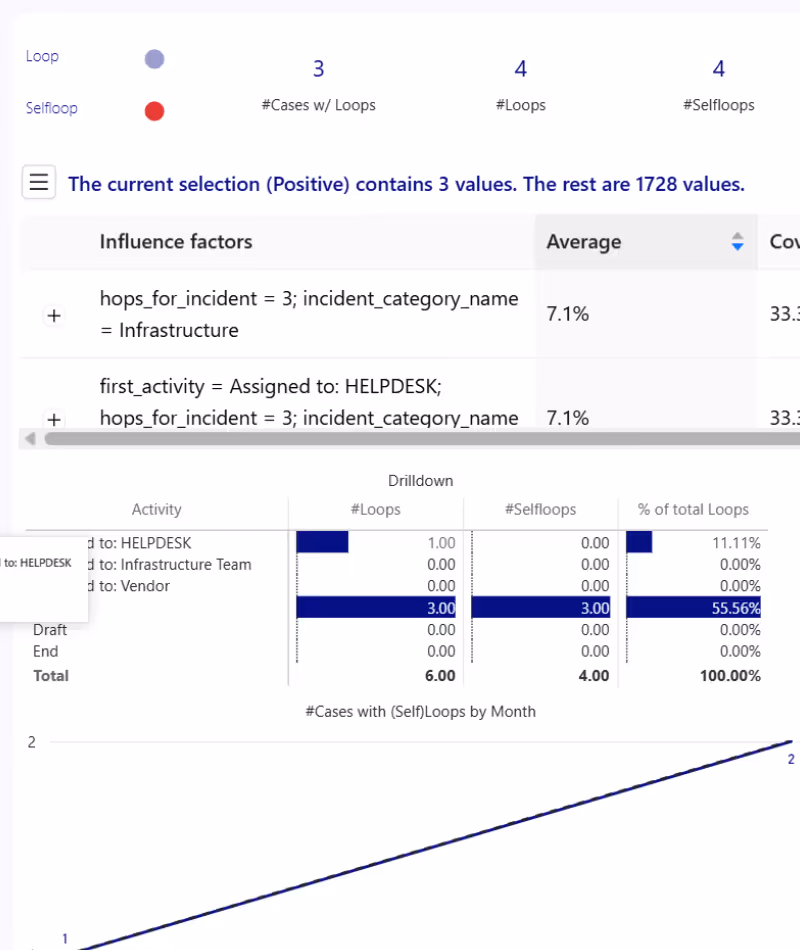
  • How often are tickets moved?
  • Where do unnecessary handovers or loops occur?
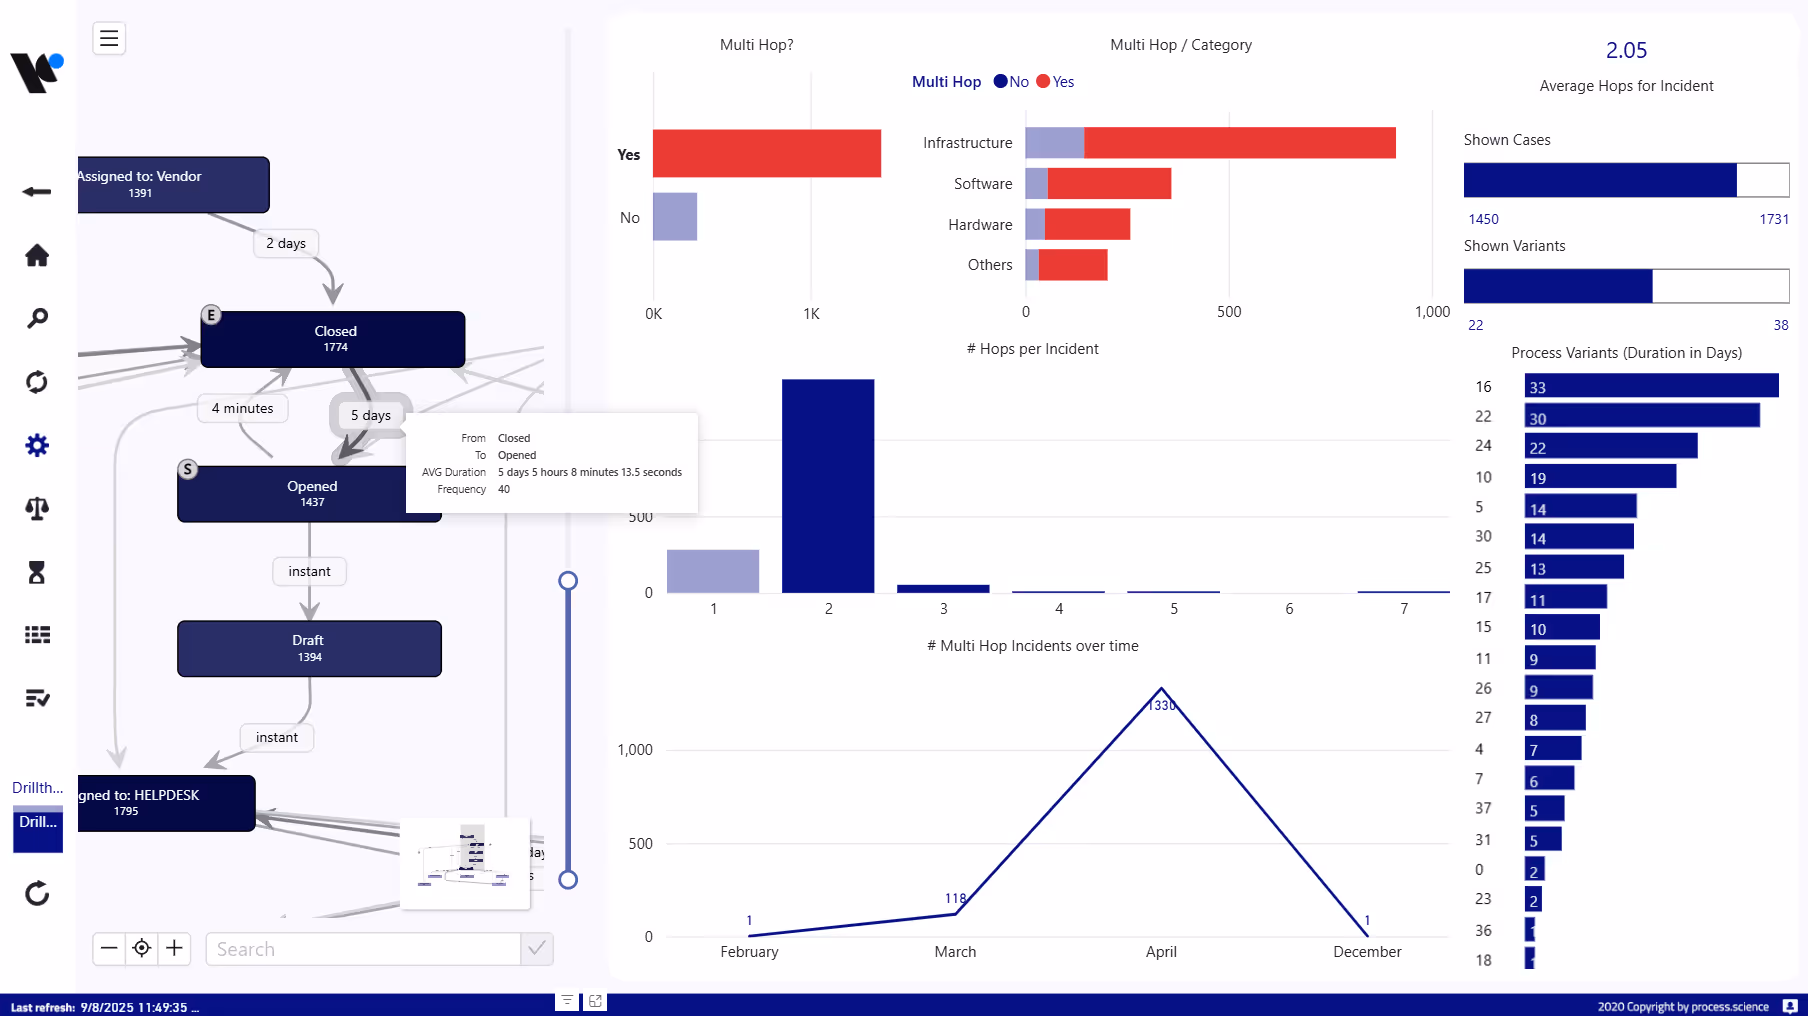
  • Which transitions do agents use most frequently – and with what impact?
  • Which process variants lead to delays?
  • How do real processes differ from the defined ‘happy path’?

Process.Science for ITSM answers these questions with data-driven, visually prepared insights that can be seamlessly integrated into your BI environment.

Why choose Process.Science for ITSM?

Understand ticket processes and increase service efficiency.

In many ITSM environments, tickets remain in progress for too long, pass through multiple departments, and exceed defined SLA times. The root causes often remain hidden directly impacting efficiency and customer satisfaction.

Process.Science brings clarity

  • Visualization of the entire ticket history
  • Automatic detection of bottlenecks, loops, and inefficient transitions
  • Analysis of process variants and their impact on throughput times
  • Workflow benchmarking over time
  • Compliance checks: How much do actual processes deviate from the target process?

Your advantages at a glance

  • Comprehensive transparency across all ITSM processes
  • Automated detection of bottlenecks and delays
  • Proactive control through intelligent service management for effective IT process optimization
  • Seamless integration into your BI landscape
  • Customer-oriented development of your IT services
Process.Science Service Management Rework Dashboard in Power BI
fast & easy

Start now with Process.Science!

Getting started with Process Mining is easier than you think. Thanks to seamless integration with existing BI systems such as Power BI or Qlik Sense, you can work with familiar tools. All you need for a quick “proof of value” is

  • Basic process data (event logs) from your systems, which our solution can extract
  • A business process as a starting point
  • 1-2 days for initial setup and first results
Process.Science Service Management Case Viewer Dashboard in Power BI

How can Process.Science transform your ITSM strategy?

Building bridges between classic ITSM and modern DevOps practices.

With Process.Science, you close the gap between traditional service processes and agile methods. Our solution offers:

  • Dynamic IT process optimization instead of static reports
  • Cross-system insights for maximum transparency
  • Early problem identification through predictive analytics
  • Uncovering untapped potential for continuous improvement
  • Visual filtering of process variants for targeted root cause analysis
Process.Science Service Management Lead Times Dashboard in Power BI

Who is Process.Science for ITSM designed for?

Our solution is ideal for:

  • IT service managers who focus on effective IT process optimization and want to reliably achieve SLA targets
  • DevOps teams seeking to eliminate deployment bottlenecks
  • IT operations managers who prefer proactive over reactive approaches
  • Jira administrators, IT, and service desk managers looking to clarify complex processes

What features make the difference?

A blue magnifying glass.

Full control over the entire ticket lifecycle

End-to-end analysis from creation to closure – including all transitions and variants.

A blue hand shake.

Reliable SLA performance and compliance monitoring

Real-time tracking and automatic adherence to ITIL standards ensure top-tier service quality.

a blue stop watch.

Identification of bottlenecks and optimization potential

Analyze transition times, loop frequency, and process deviations at the activity level.

a opened blue book.

Improvement of change and resource management

Intelligent analyses and precise capacity planning ensure smooth processes and thus promote IT process optimization.

A blue lightning.

Sustainable efficiency gains through automation

Identify repetitive tasks and uncover automation potential – fully integrated into your BI environment.

Part of the Process.Science Team: Babette, André & Lucas M.

How to get started

Want to learn more about the benefits and use cases or get started right away? Here are your next steps:

Schedule a demo

Let us show you the solution for IT process optimization in a personalized presentation—tailored precisely to your requirements.

Join us live every two weeks

Our webinar shows you how to analyze ITSM processes more intelligently.

Start now

Schedule an appointment

Start analyzing and optimizing your processes today. Please contact us for an individual offer.

CONTACT