Shop Floor Process Mining

Turn sensor datainto real process activities

The Process.Science IoT Miner uses machine learning to recognise what your machines are actually doing, turns those states into process activities and links them to the production orders in your ERP. Process mining that reaches all the way to the shop floor.

Your ERP knows the order.
Your machines know the rest

Between „order released“ and „order finished“ lies everything that happens on the shop floor. The IoT Miner makes that part visible, in the same event log as the rest of your process.
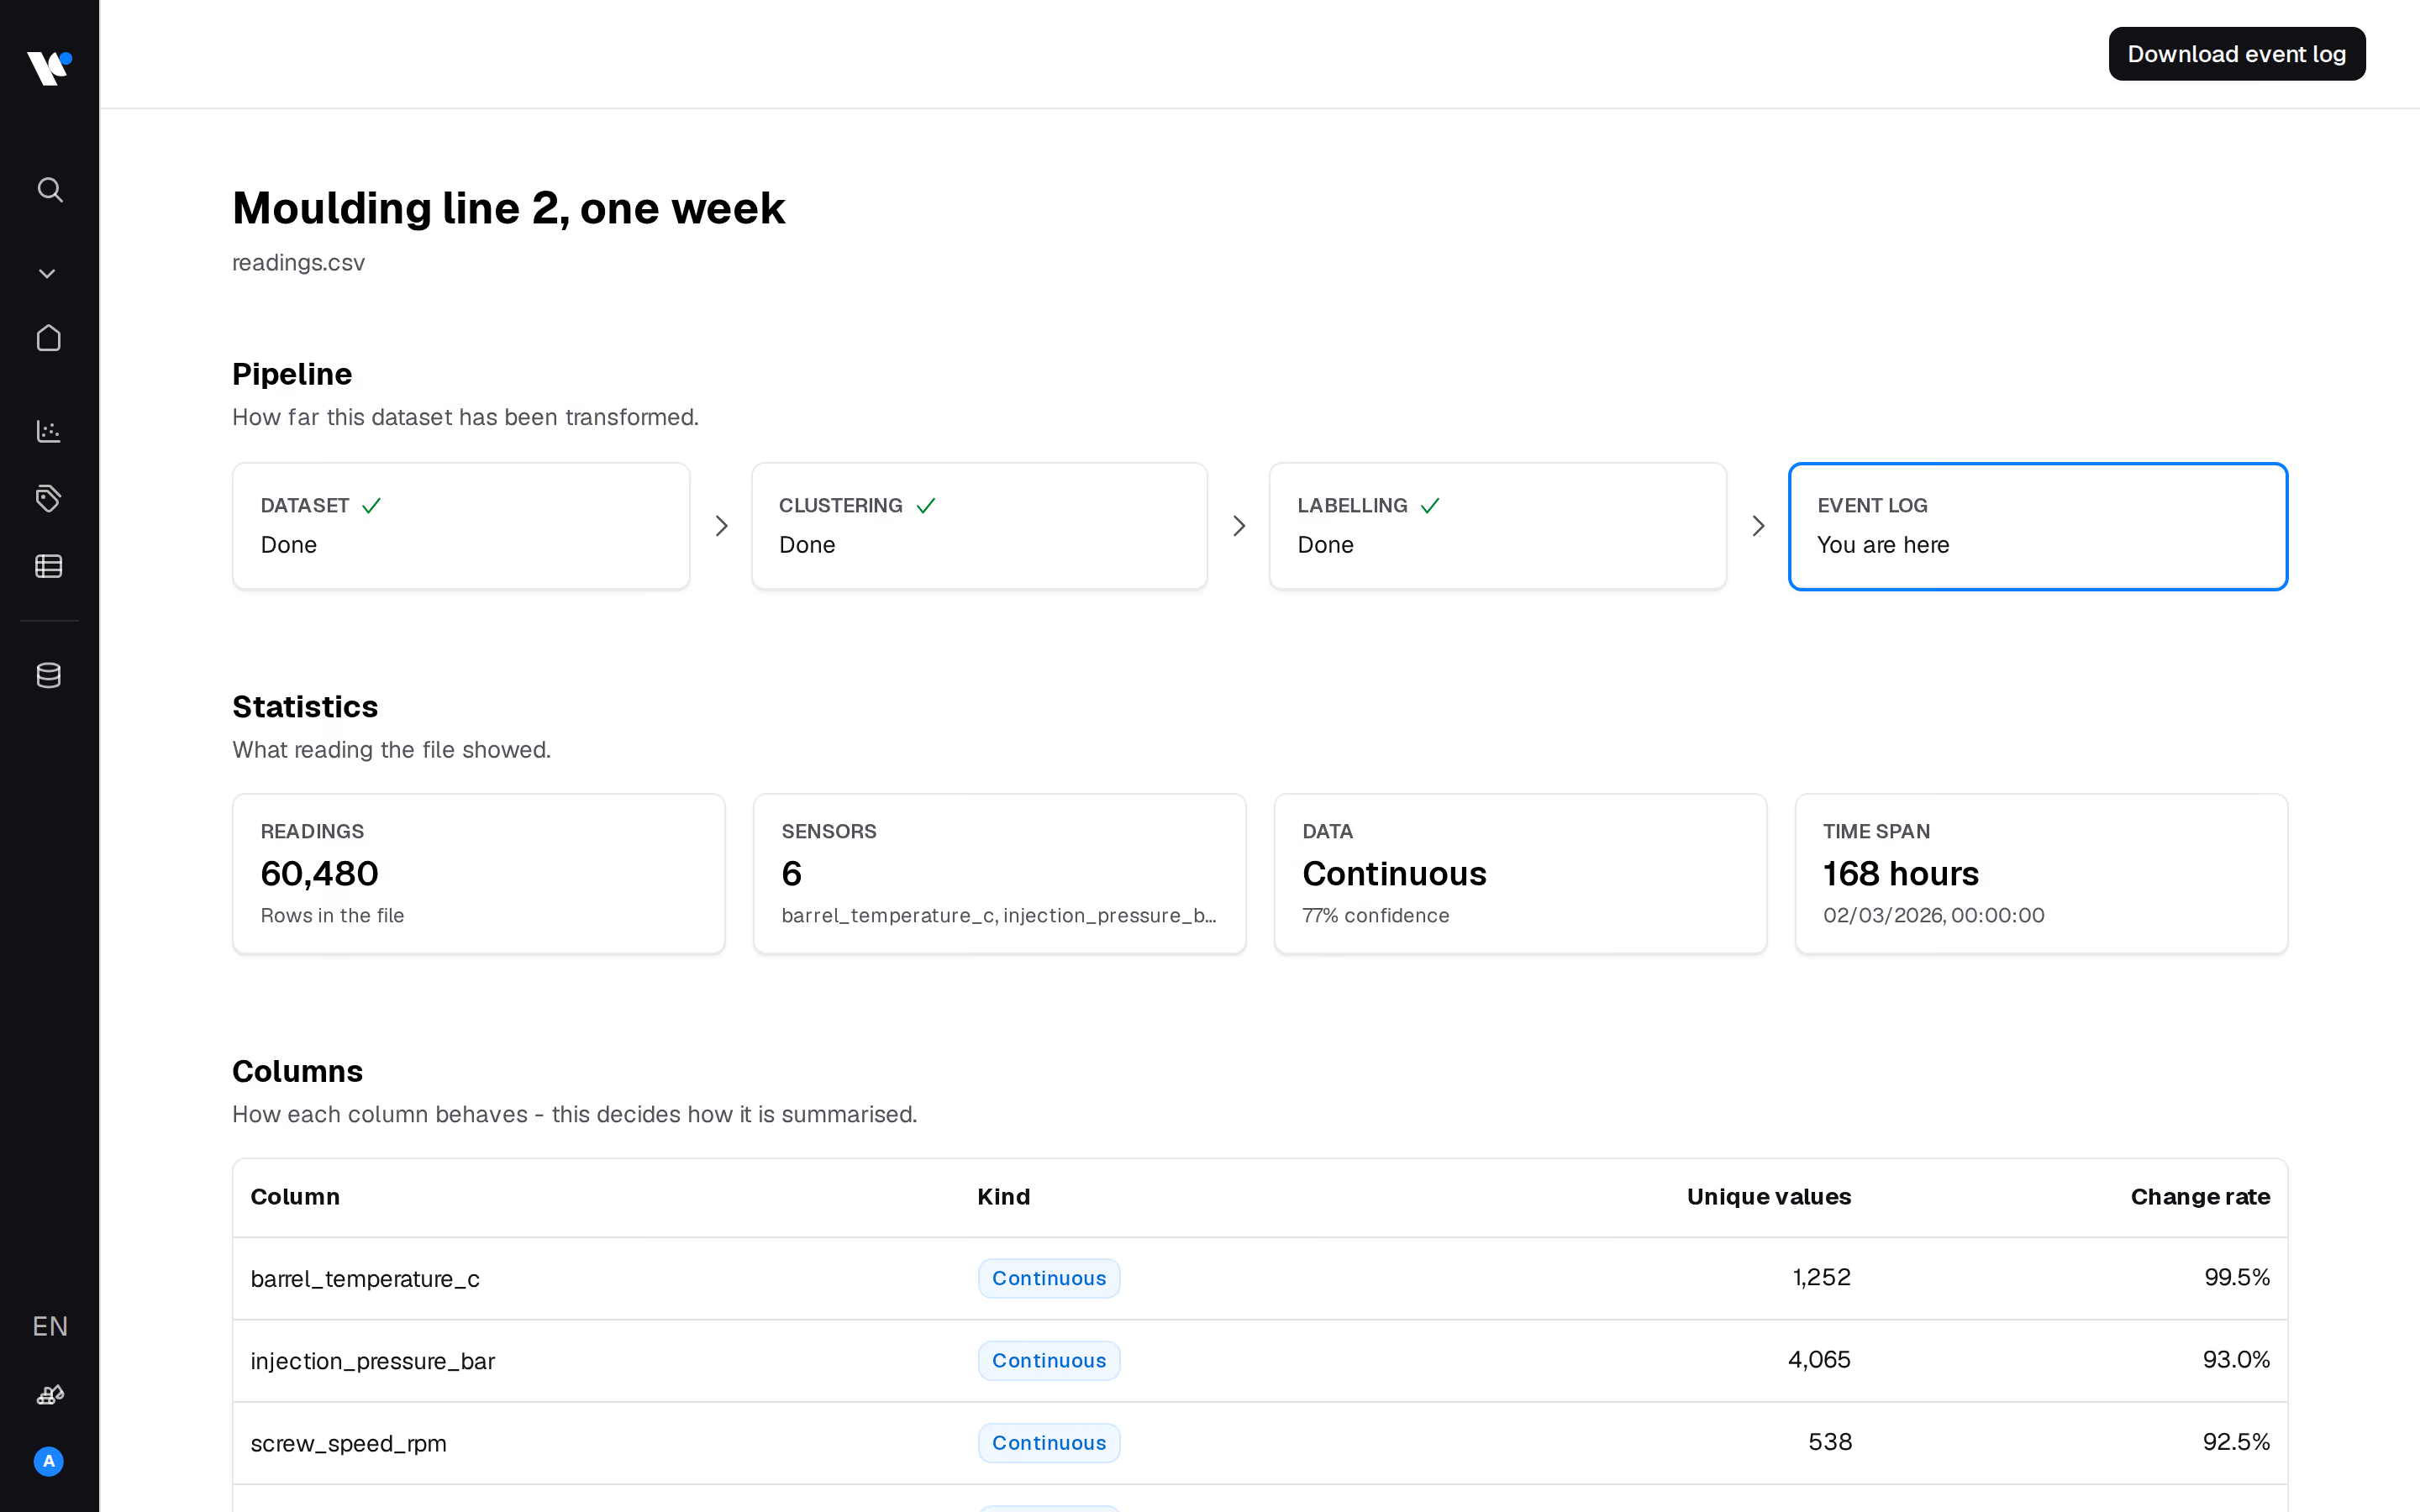
Dashboard interface titled 'Moulding line 2, one week' displaying the progress of a data processing pipeline with steps 'Dataset', 'Clustering', 'Labelling' marked as Done and 'Event Log' as current step. Statistics show 60,480 readings, 6 sensors, continuous data with 77% confidence, and a 168-hour time span starting from 02/03/2026. A columns summary table lists three sensor types barrel_temperature_c, injection_pressure_bar, screw_speed_rpm, all continuous with unique values and change rates: 1,252 (99.5%), 4,065 (93.0%), and 538 (92.5%) respectively. The interface includes a sidebar menu and a 'Download event log' button.
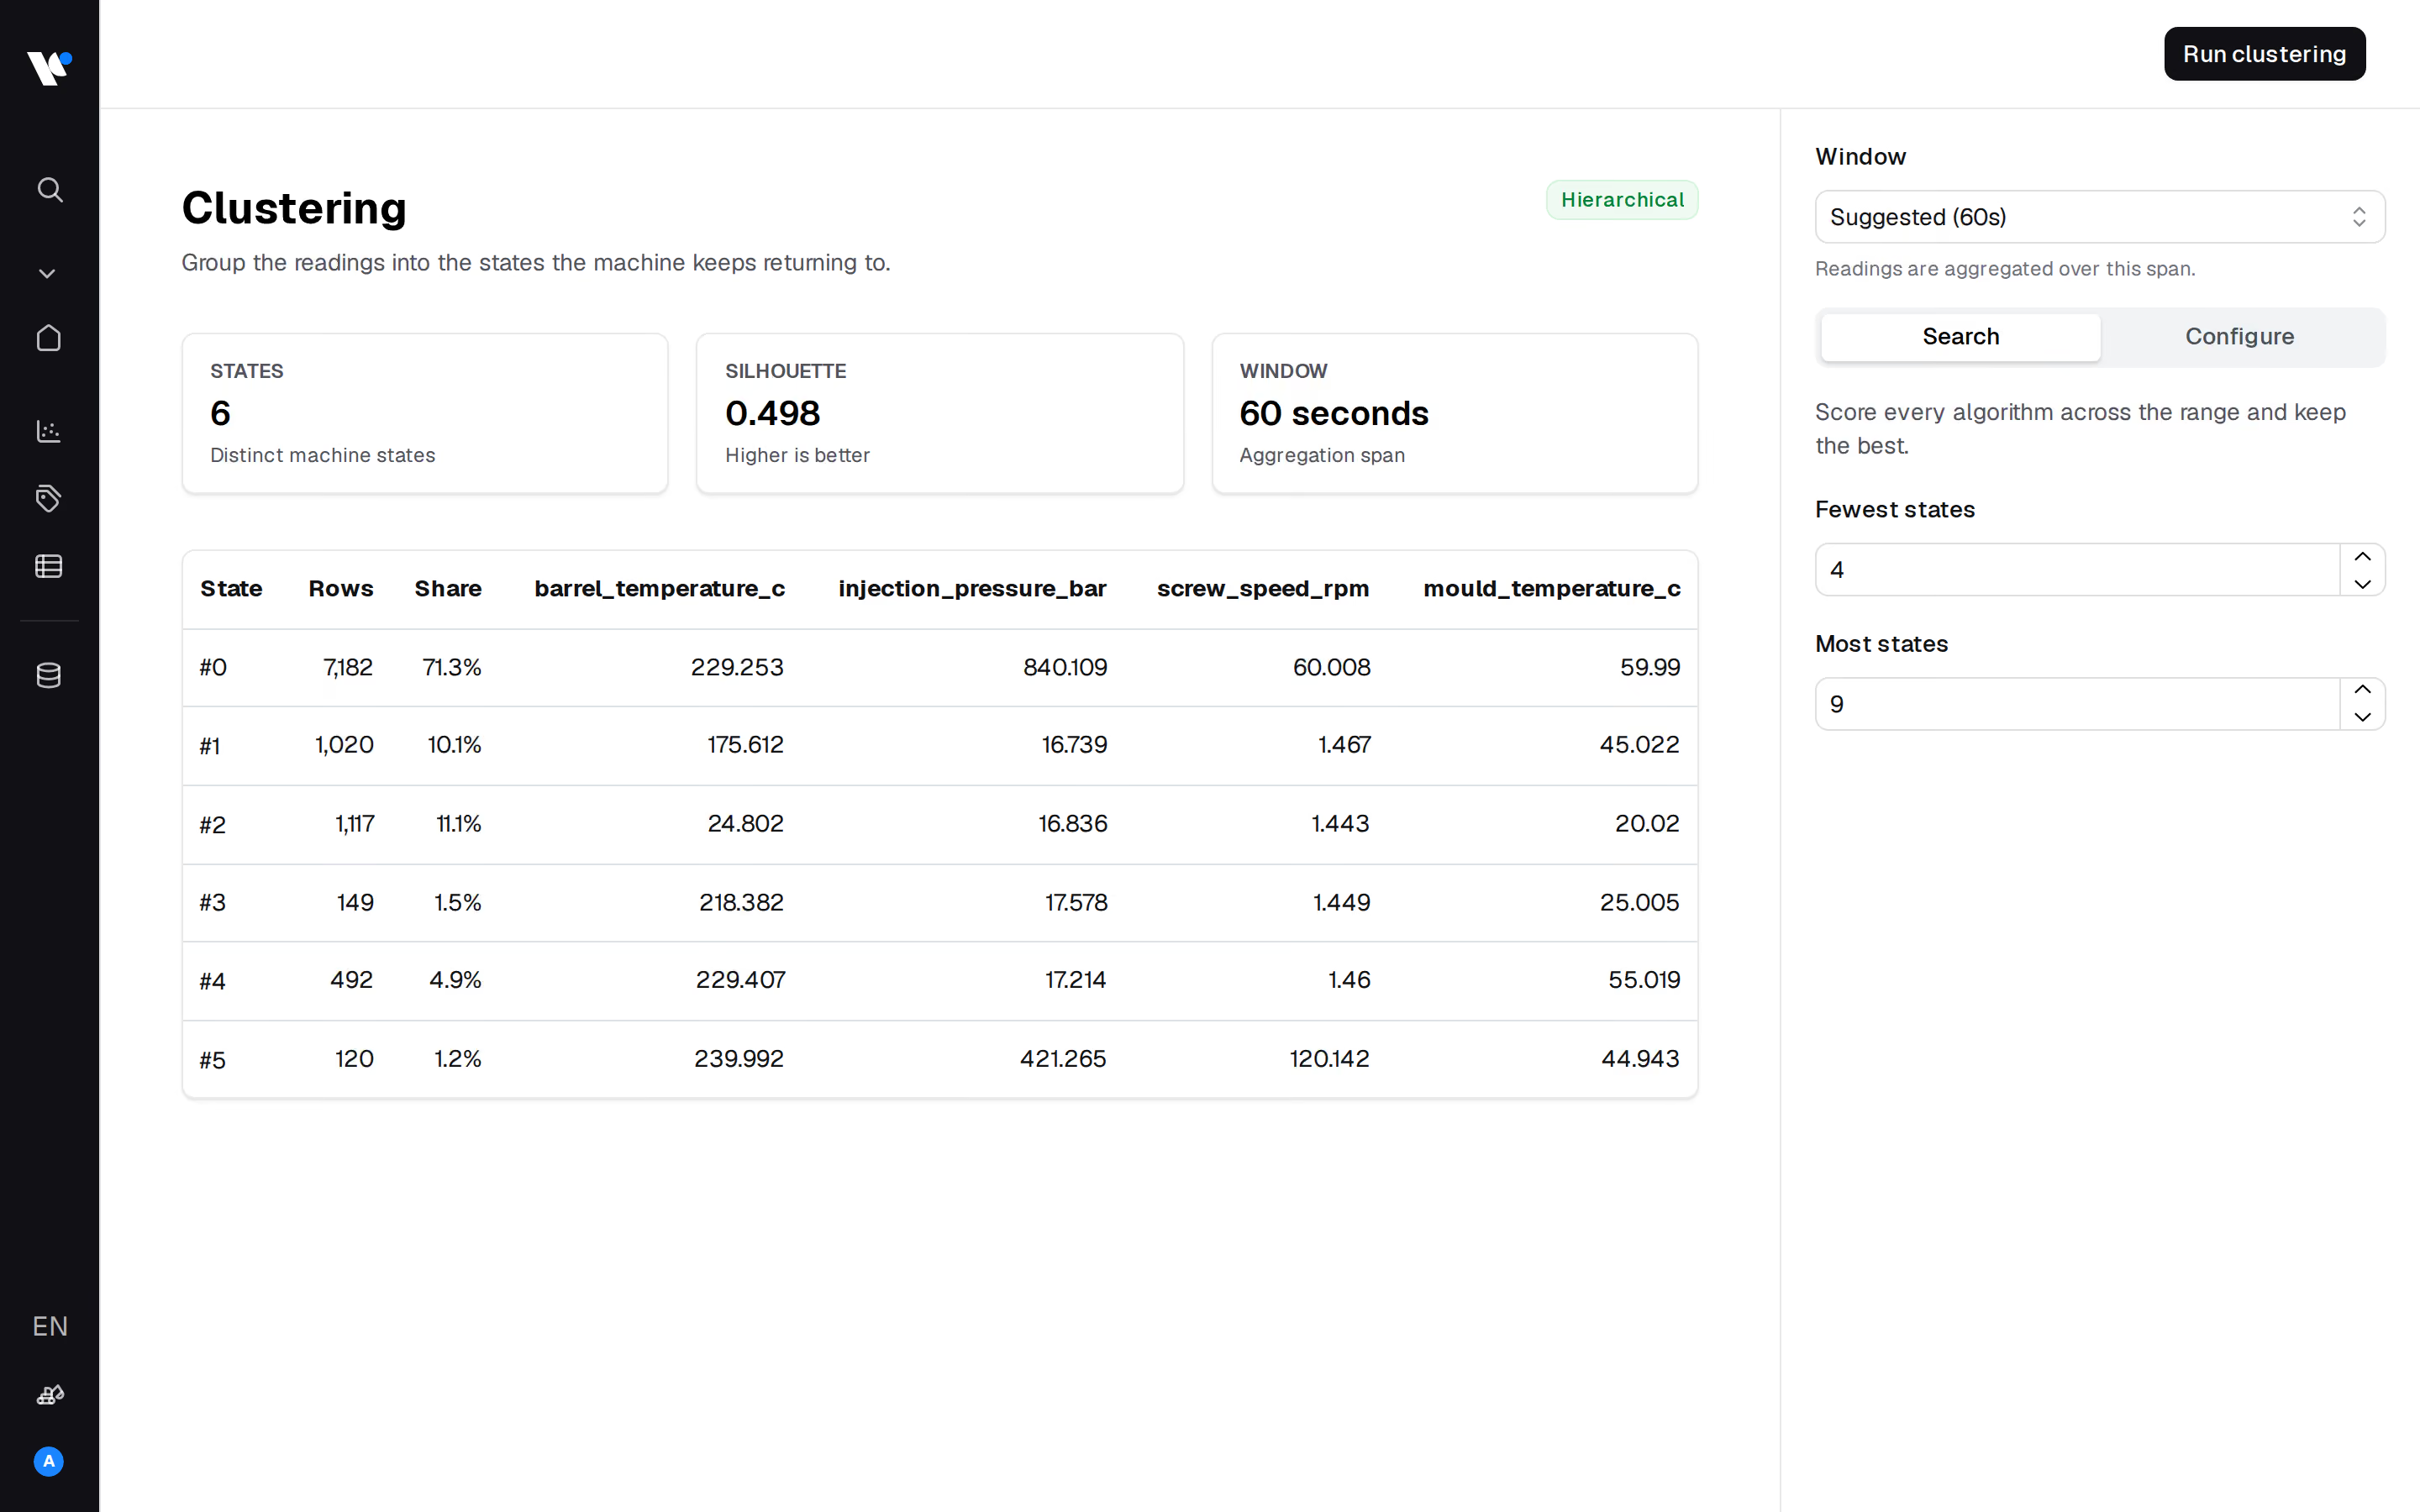
Dashboard screen titled 'Clustering' showing clustering configuration for machine state readings. Displays six distinct machine states with a silhouette score of 0.498 and a 60-second window aggregation span. Table lists states #0 to #5 with rows, share percentages, and metrics for barrel temperature, injection pressure, screw speed, and mould temperature. Controls on the right allow selection of window span, search, configuration options, and setting fewest and most states. Sidebar with icons is visible on the left.
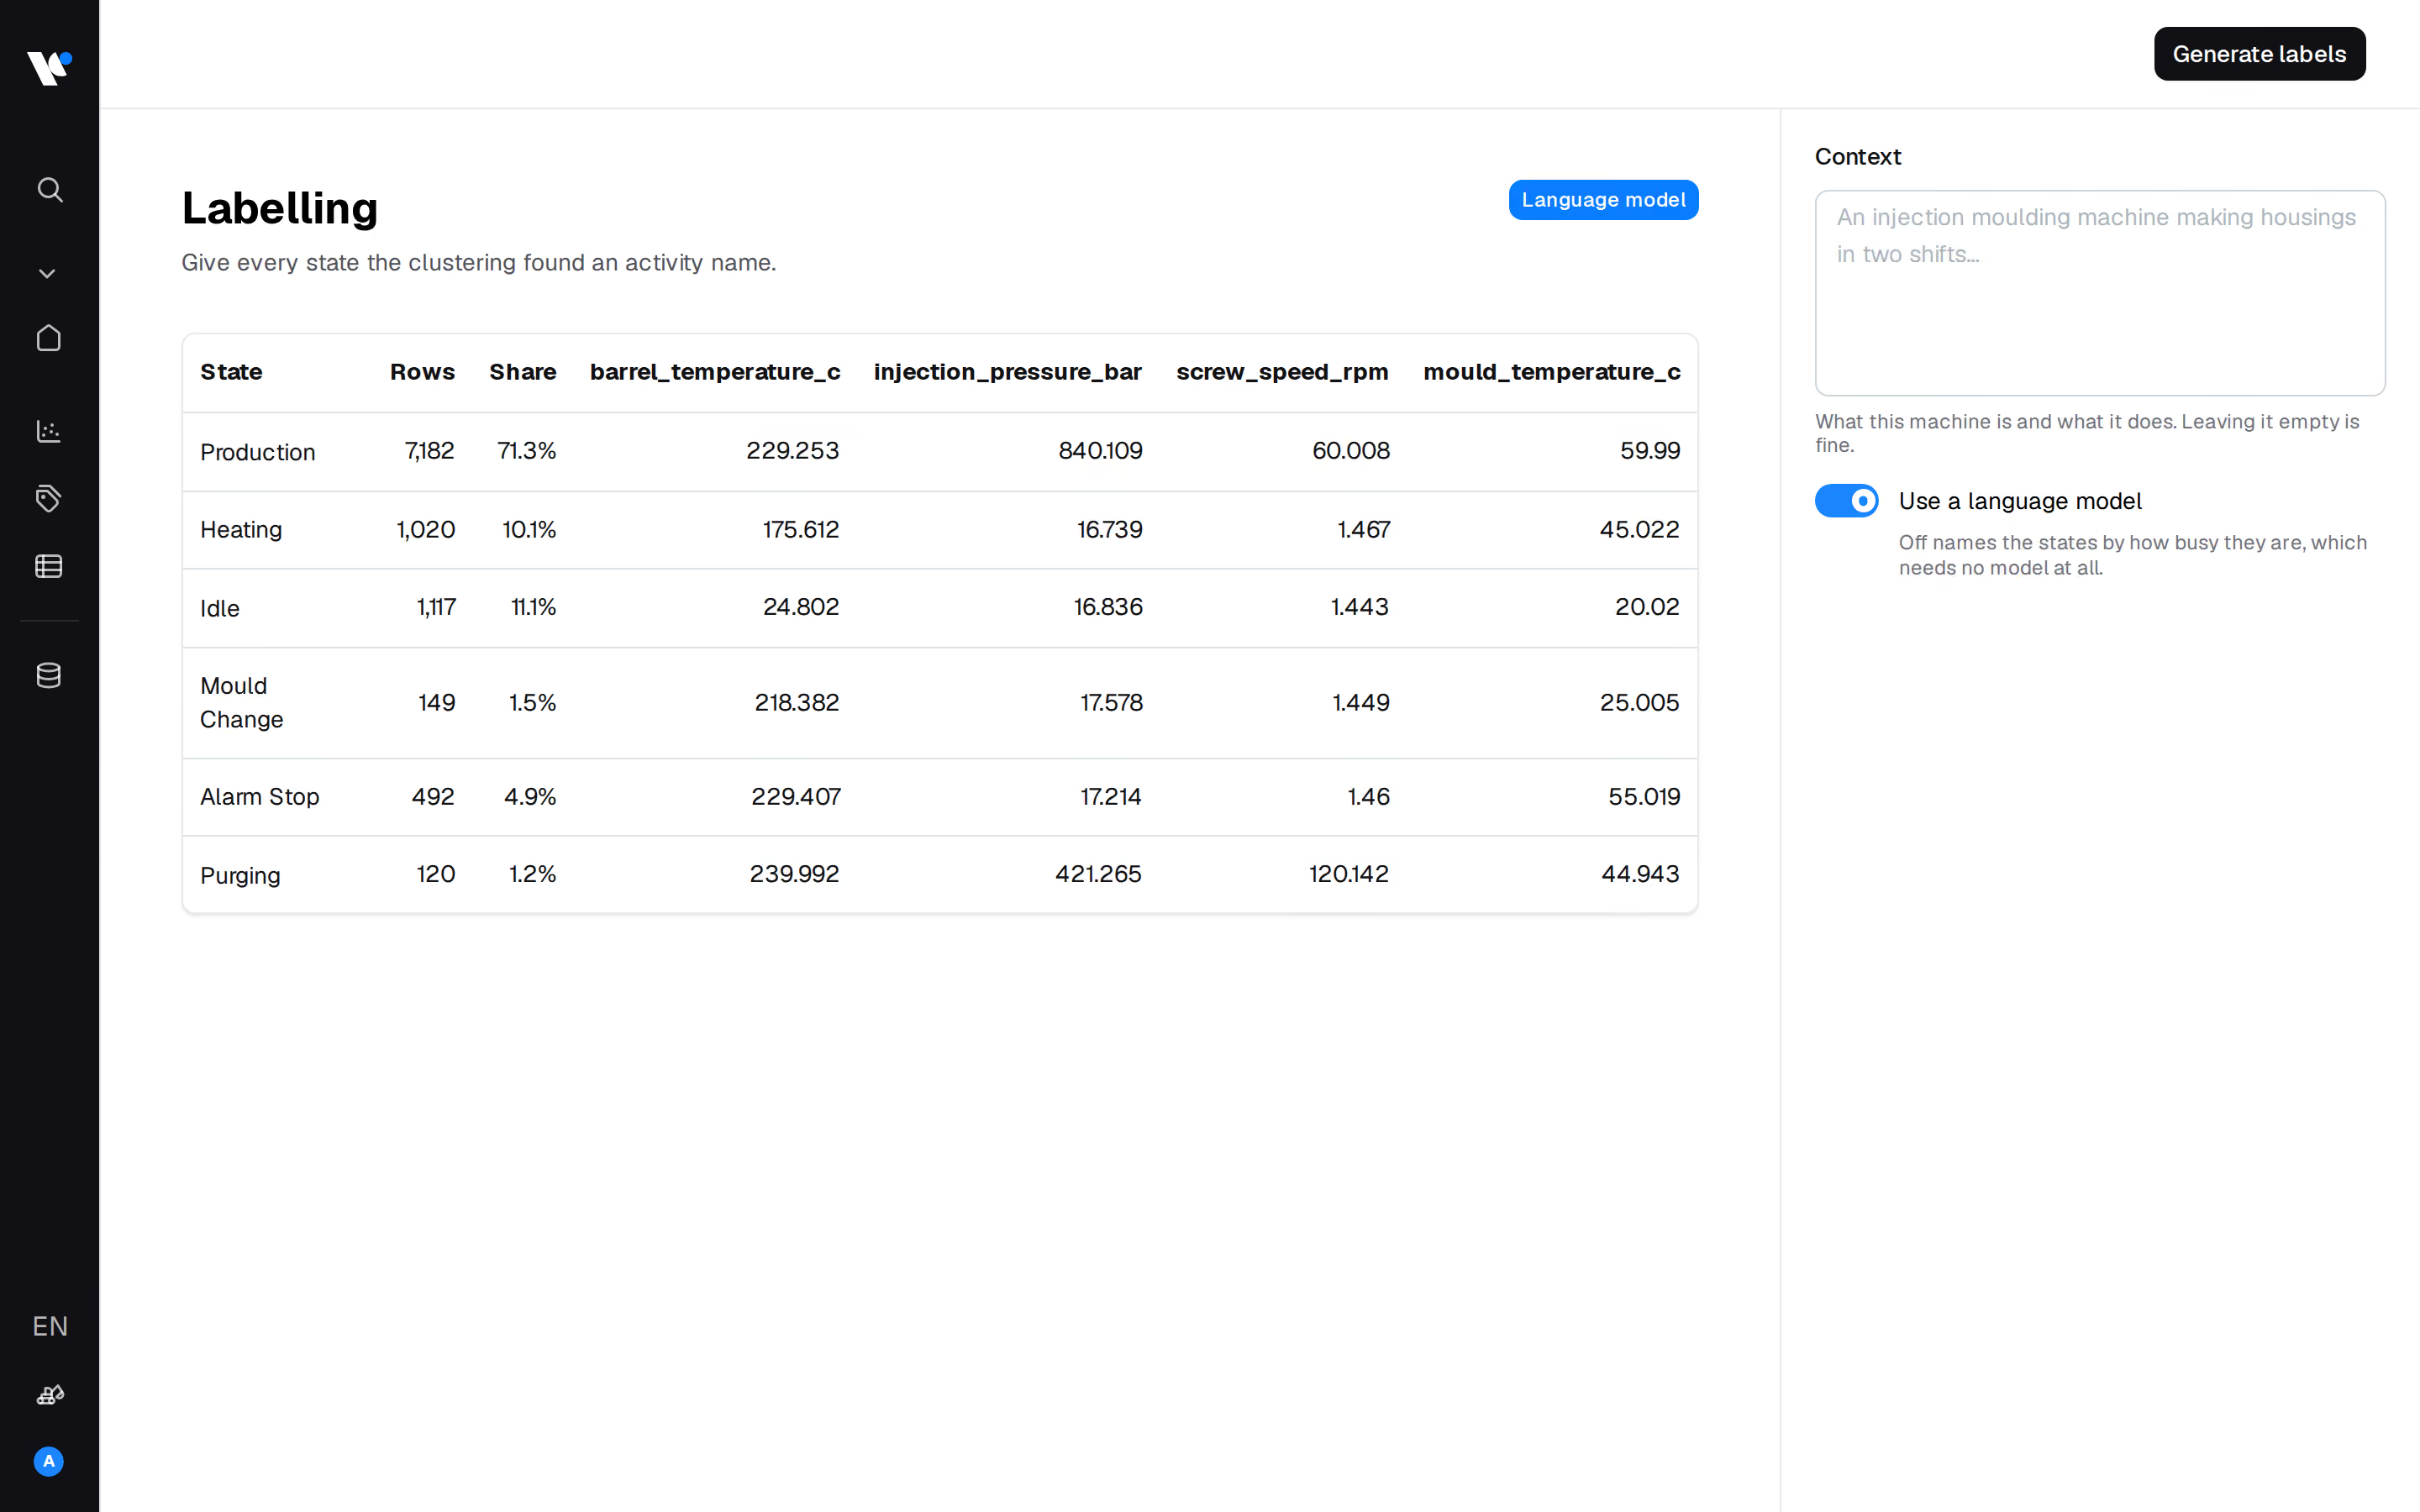
Screen showing a labelling interface for clustering activity states with a table listing states such as Production, Heating, Idle, Mould Change, Alarm Stop, and Purging, alongside columns for Rows, Share percentage, barrel temperature, injection pressure, screw speed, and mould temperature. On the right, a context input box describes an injection moulding machine making housings in two shifts and an option toggle to use a language model for naming states.
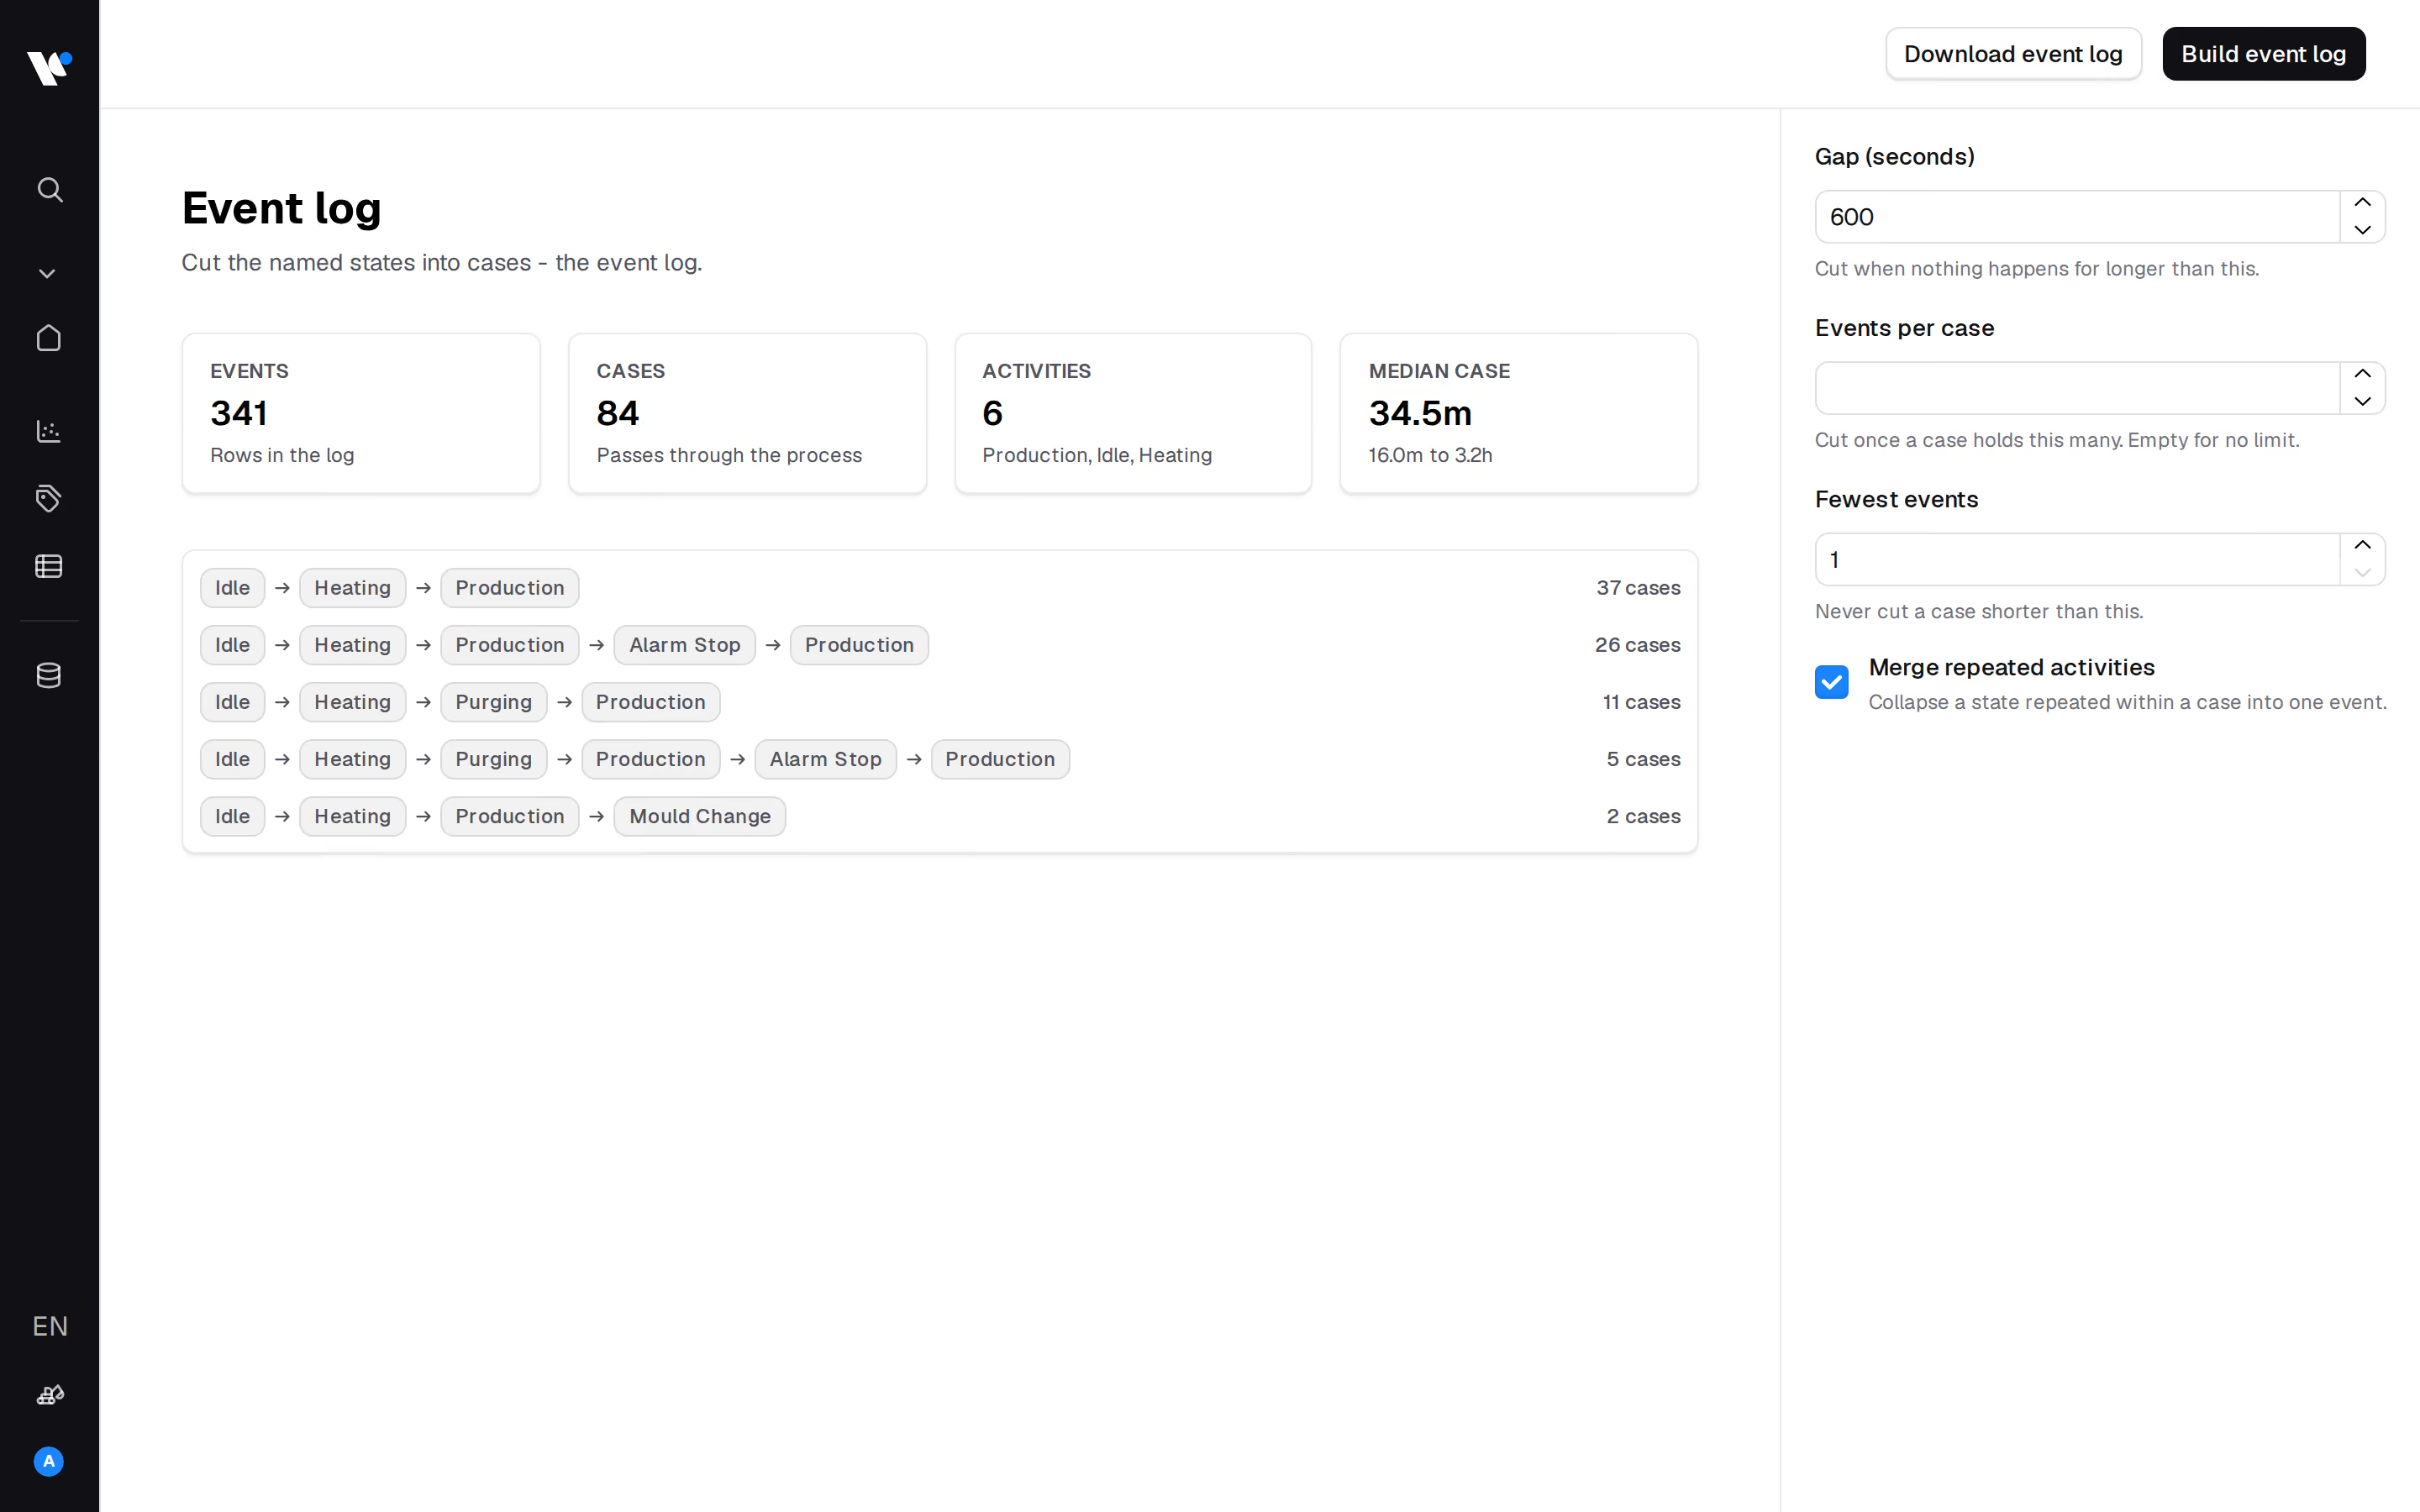
Dashboard interface showing an event log with 341 events, 84 cases, 6 activities, and median case duration of 34.5 minutes. Activity sequences like Idle to Heating to Production are listed with case counts. Controls on the right allow setting gap duration, events per case, fewest events, and merging repeated activities. Buttons for downloading and building the event log are at the top right.
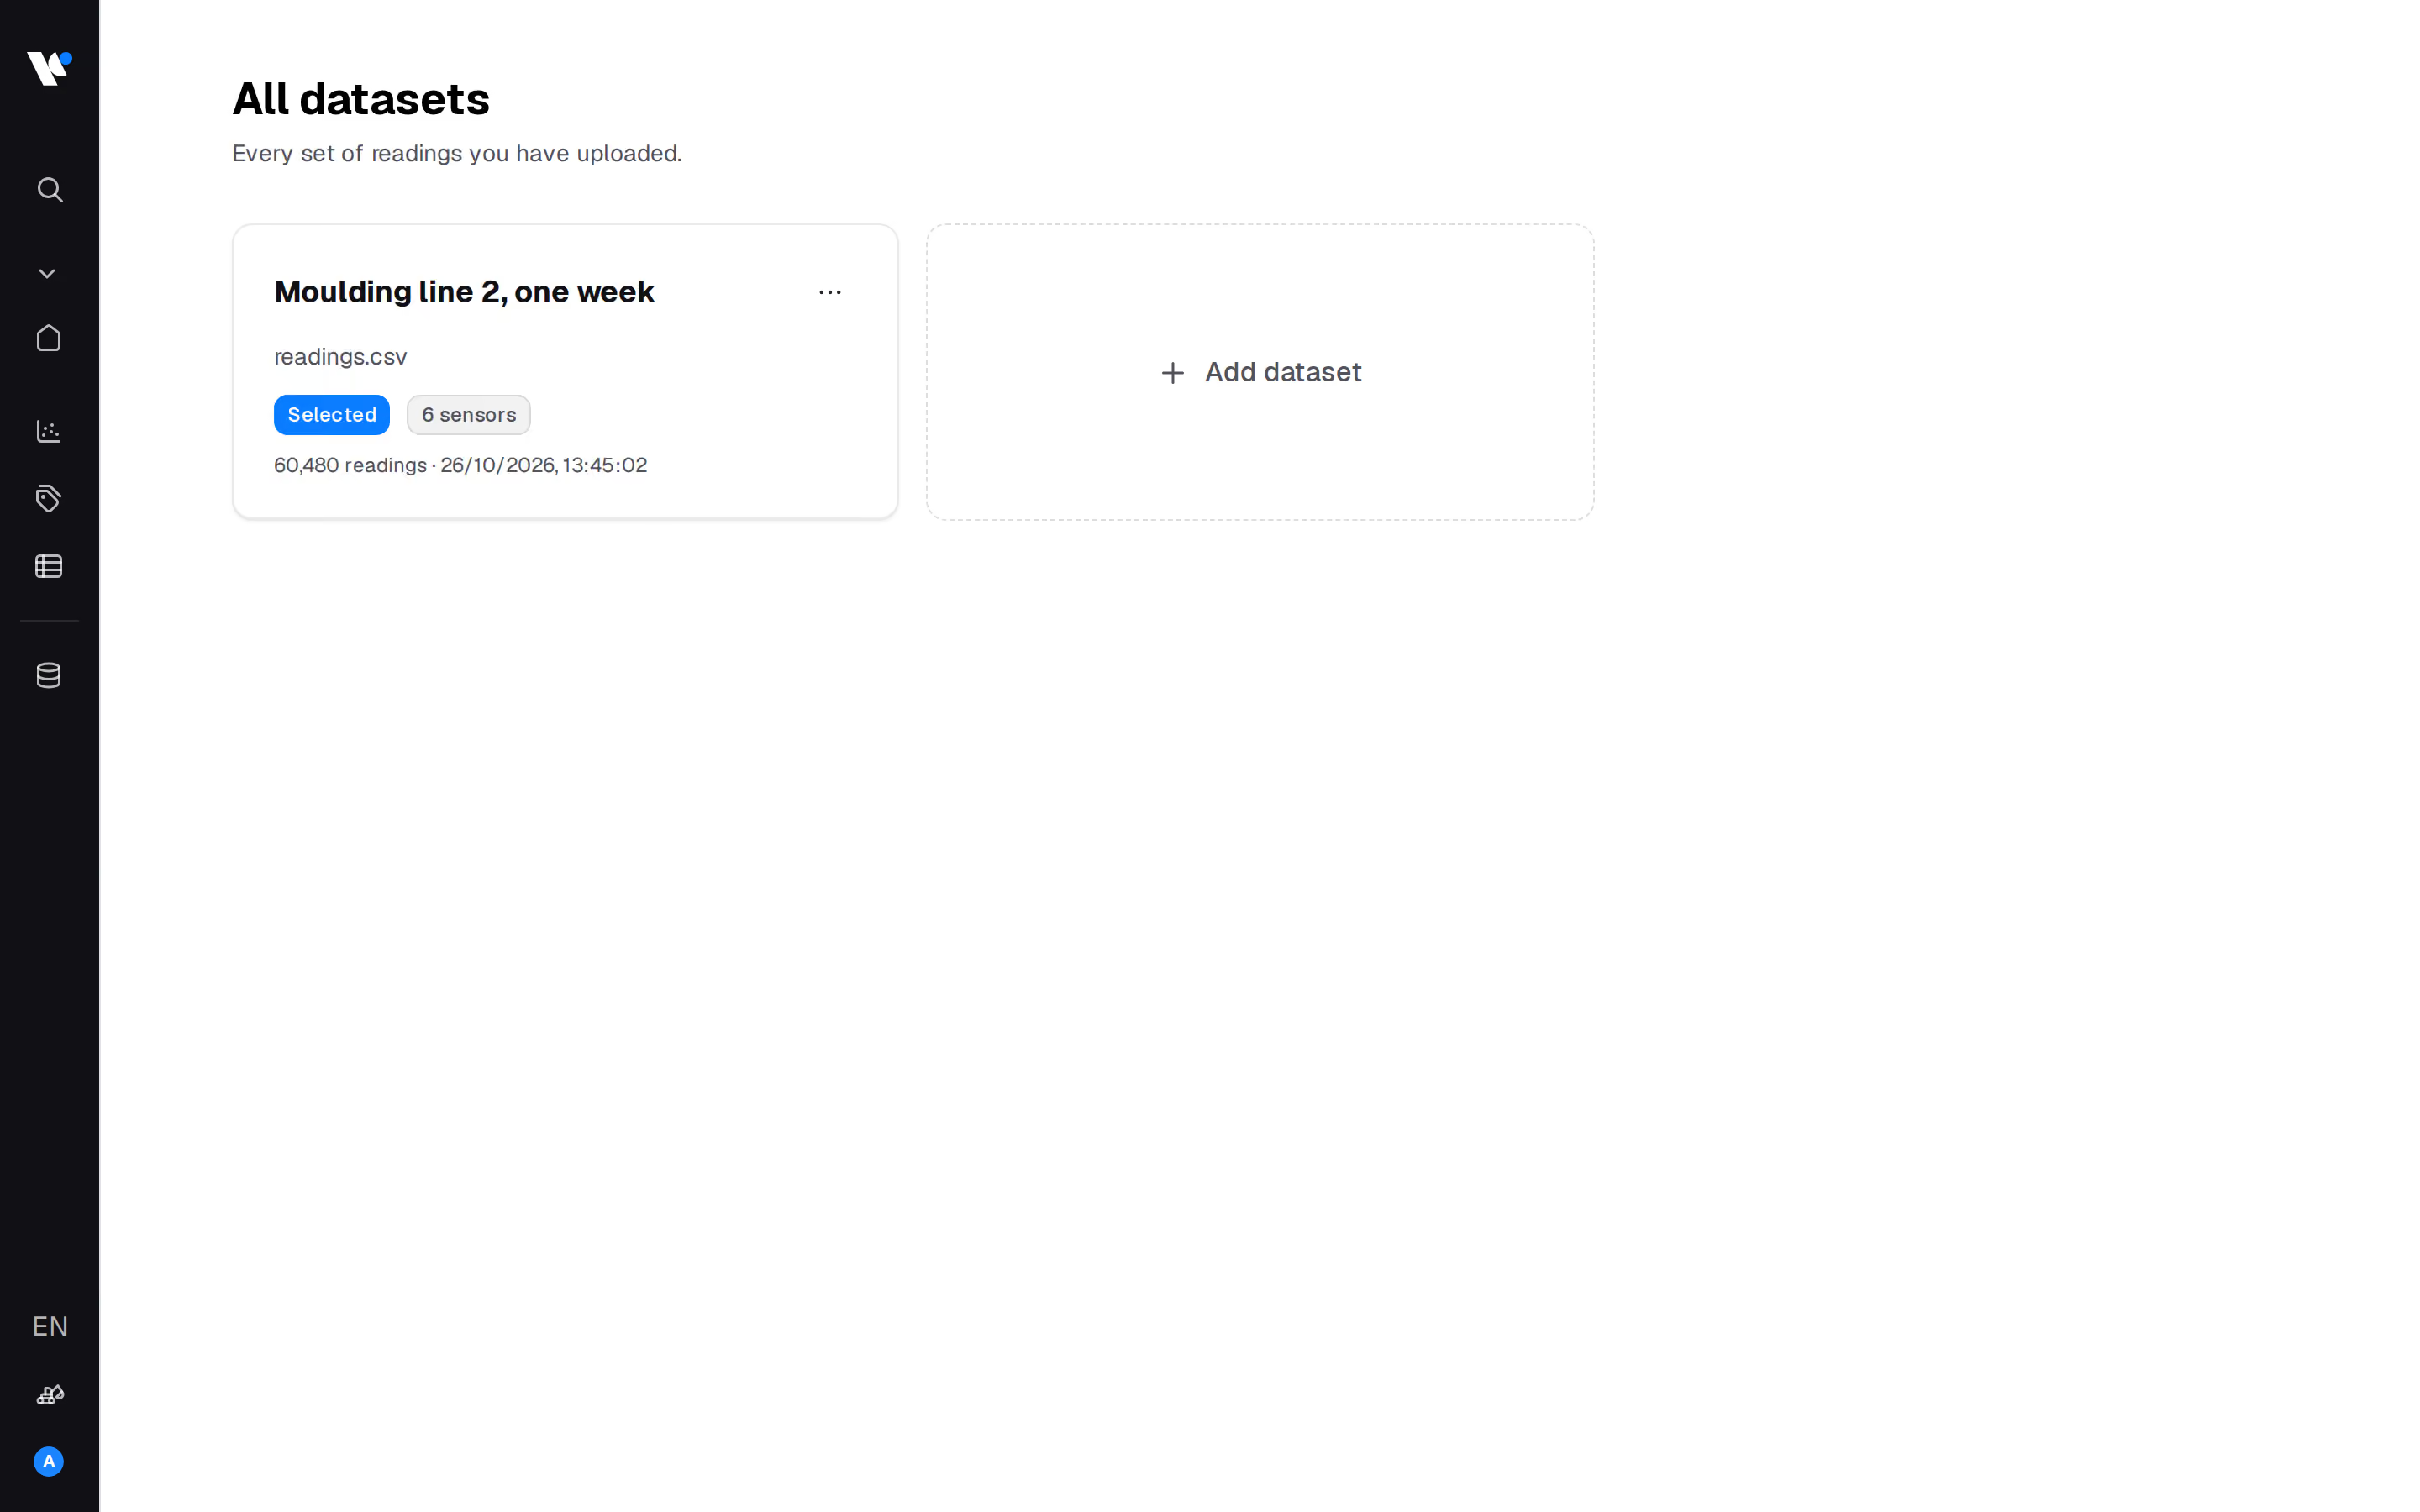
User interface showing 'All datasets' section with one dataset titled 'Moulding line 2, one week' containing 60,480 readings from six sensors, dated 26/10/2026 at 13:45:02. There is a button to add a dataset. The interface has a vertical black sidebar with icons for navigation and language set to English.

Understand every standstill

Micro-stoppages and faults become visible as activities of their own, with start, end and frequency.

Trace delays to the machine

When an order is late, you see which state on which machine caused it.

One view for planning and production

Machine events and ERP orders sit in the same event log, so planning and production talk about the same facts.
The Process.Science formula

From machine signalto process insight

Sensor dashboards

Show what a machine measured. Temperature, power, vibration. A reliable picture of the signal.

Process mining on ERP data

Shows how an order moved through planning, production and delivery. Between release and completion, it sees a single step.

Process.Science IoT Miner

Puts the real machine activities into that step. You see which state on which machine delayed which order and how often.

Your machine data decodedin three moves

Cluster finds the patterns. Label gives them a name. Merge connects them to your orders
Cluster

Let the data show its patterns

Machine learning finds the states in your sensor data, without hand-written thresholds.
Recurring states:Up to 80% of processes recognised without manual modelling.
Anomalies isolated:Micro-stoppages and faults become clusters of their own, exactly timed.
Standard connections:IoT gateways, OPC UA and SCADA.
Dashboard screen titled 'Clustering' showing clustering configuration for machine state readings. Displays six distinct machine states with a silhouette score of 0.498 and a 60-second window aggregation span. Table lists states #0 to #5 with rows, share percentages, and metrics for barrel temperature, injection pressure, screw speed, and mould temperature. Controls on the right allow selection of window span, search, configuration options, and setting fewest and most states. Sidebar with icons is visible on the left.
Screen showing a labelling interface for clustering activity states with a table listing states such as Production, Heating, Idle, Mould Change, Alarm Stop, and Purging, alongside columns for Rows, Share percentage, barrel temperature, injection pressure, screw speed, and mould temperature. On the right, a context input box describes an injection moulding machine making housings in two shifts and an option toggle to use a language model for naming states.
Label

Your experts name it once

A cluster called „State A“ means nothing in a process graph. Your experts give it a name once.
AI suggests:The IoT Miner proposes a business name for every cluster.
People confirm:Whoever knows the machine accepts or corrects it. No data scientist required.
Learned for good:Every confirmed label is reused on all new data.
Merge

One event log for order and machine

Machine activities are matched to the orders in your ERP or MES by order number and time.
One source of truth:The machine events sit inside the ERP step „Order 4711 in production“.
Root cause down to the machine:Order 4711 was late because „Micro-stoppage machine 3“ occurred 15 times.
Lean by design:Only recognised states travel on, not terabytes of raw curves.
Dashboard interface showing an event log with 341 events, 84 cases, 6 activities, and median case duration of 34.5 minutes. Activity sequences like Idle to Heating to Production are listed with case counts. Controls on the right allow setting gap duration, events per case, fewest events, and merging repeated activities. Buttons for downloading and building the event log are at the top right.
Expert Insights

IoT Mining in Practice

How is machine data transformed into genuine process insights? Founder Lucas M. Schroth demonstrates how the Process.Science IoT Miner automatically recognises production processes, links machine and process data, and highlights opportunities for optimisation.
Automatically identifying processes from sensor data
Highlighting patterns and deviations
Translating production data into concrete insights
The perfect setup

Built for yourPower BIandIntelligence

The IoT Miner adds the shop floor to the process mining you already run. The Data Preparation Tool merges machine and order data and the result flows into the system you work in.

Data Preparation Tool

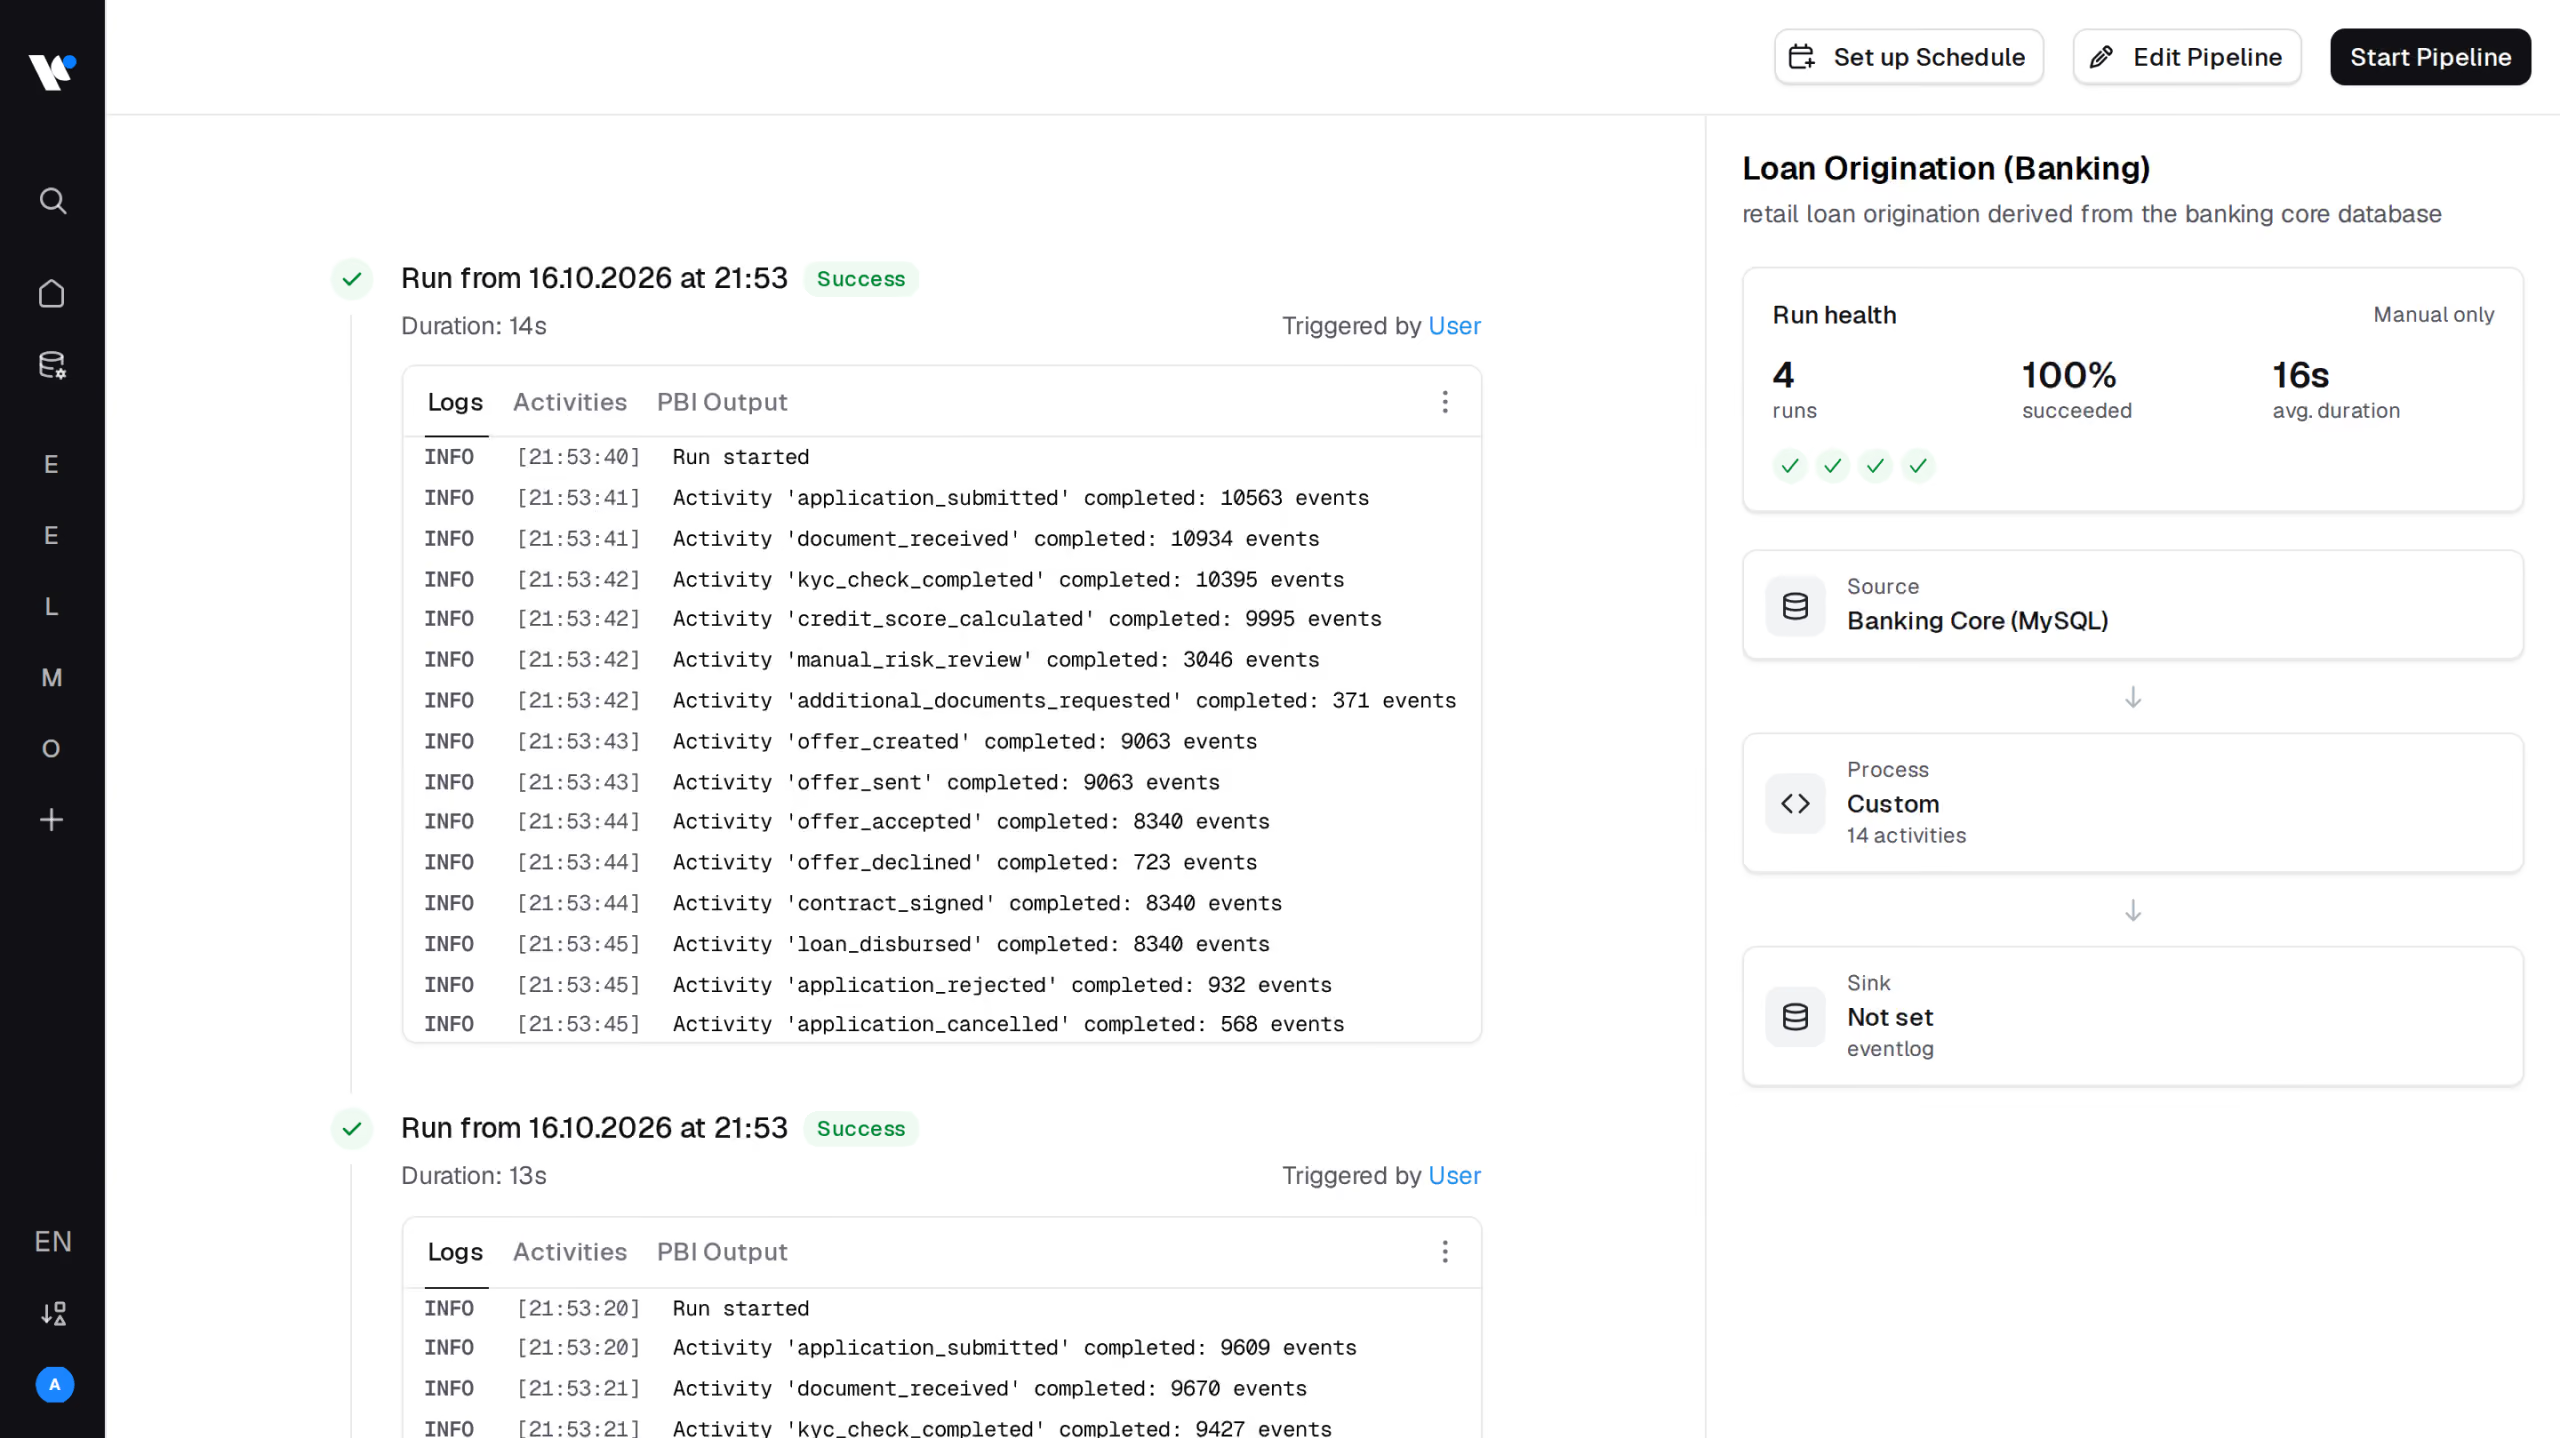
Brings your ERP data into shape and merges the machine activities with your production orders, on every scheduled run.
Dashboard interface for a loan origination pipeline showing two successful runs on 16.10.2026 at 21:53, with logs detailing completed events like application submitted, document received, kyc check, credit score calculated, manual risk review, offer created and accepted, contract signed, loan disbursed, and application rejected. On the right, the Loan Origination (Banking) section shows run health with 4 runs, 100% success rate, and average duration of 16 seconds. Source is Banking Core (MySQL), process is custom with 14 activities, and sink is not set. Buttons for Set up Schedule, Edit Pipeline, and Start Pipeline are at the top.

Power BI integration

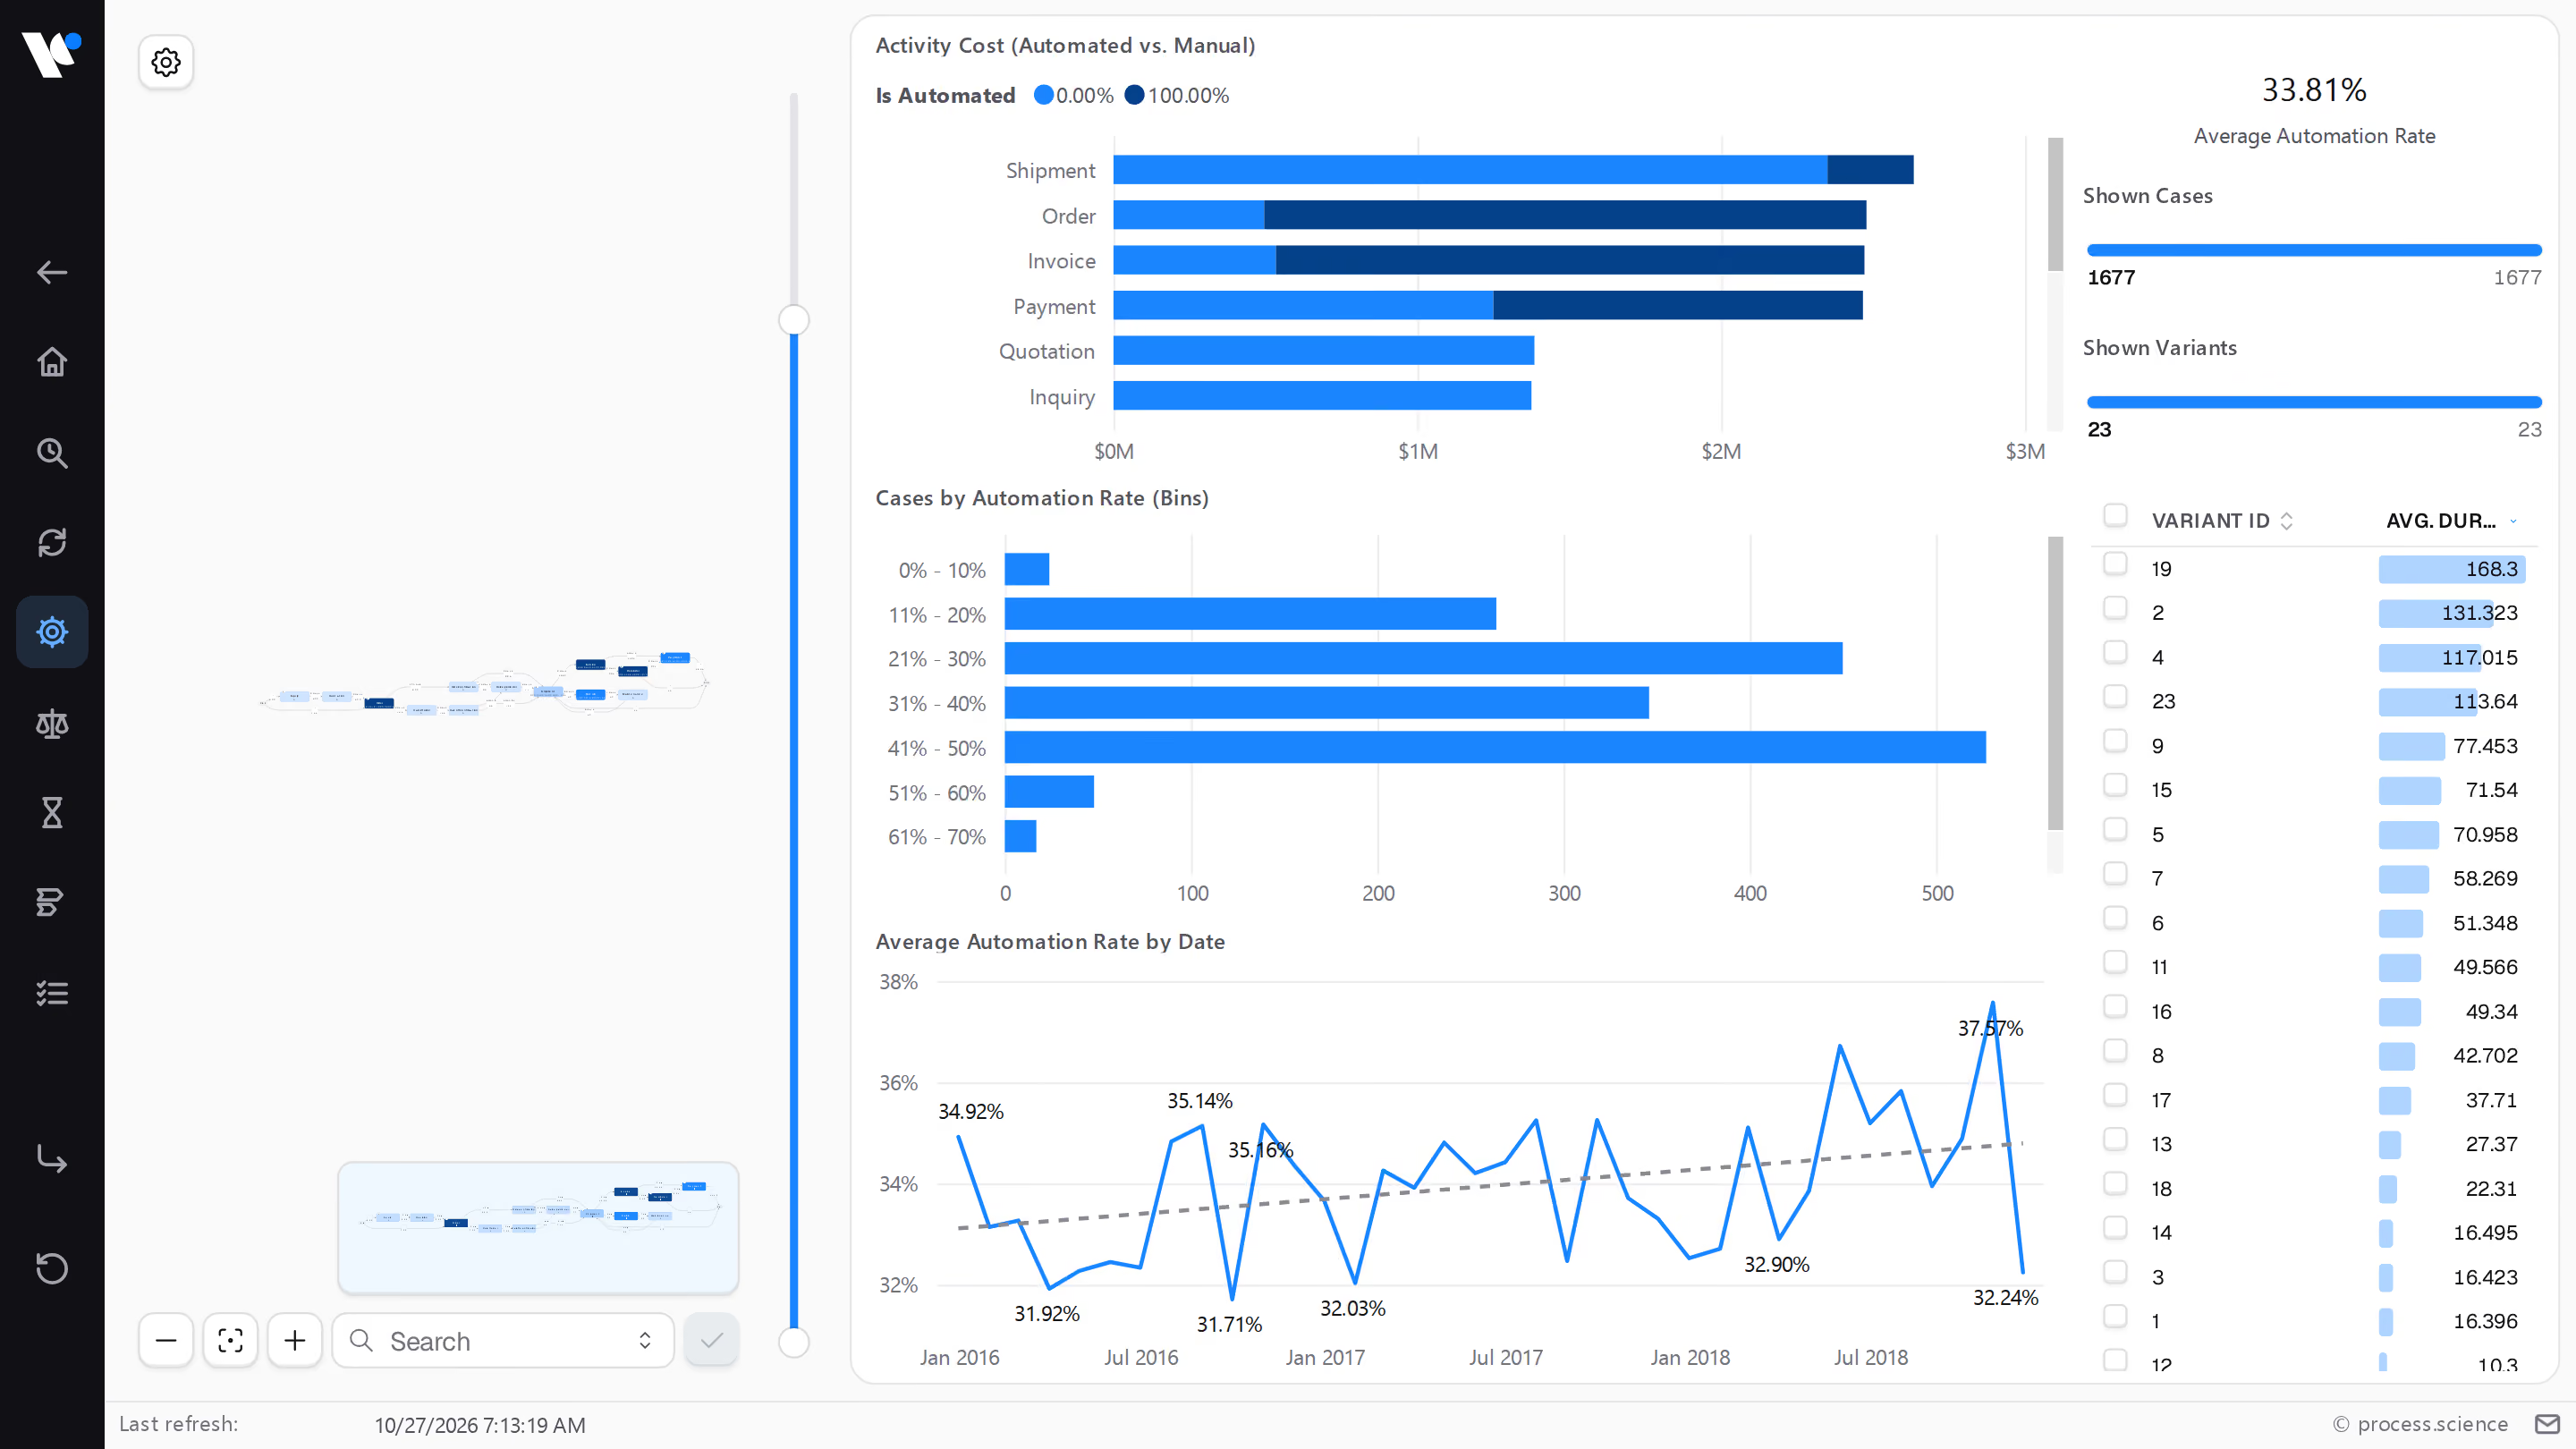
The output tables have the layout our Power BI report templates expect. Your event log lands in your own model, next to your existing dimensions, and the dashboards work without per-project rework.
Automation rates by activity and over time in Process.Science

Process.Science Intelligence

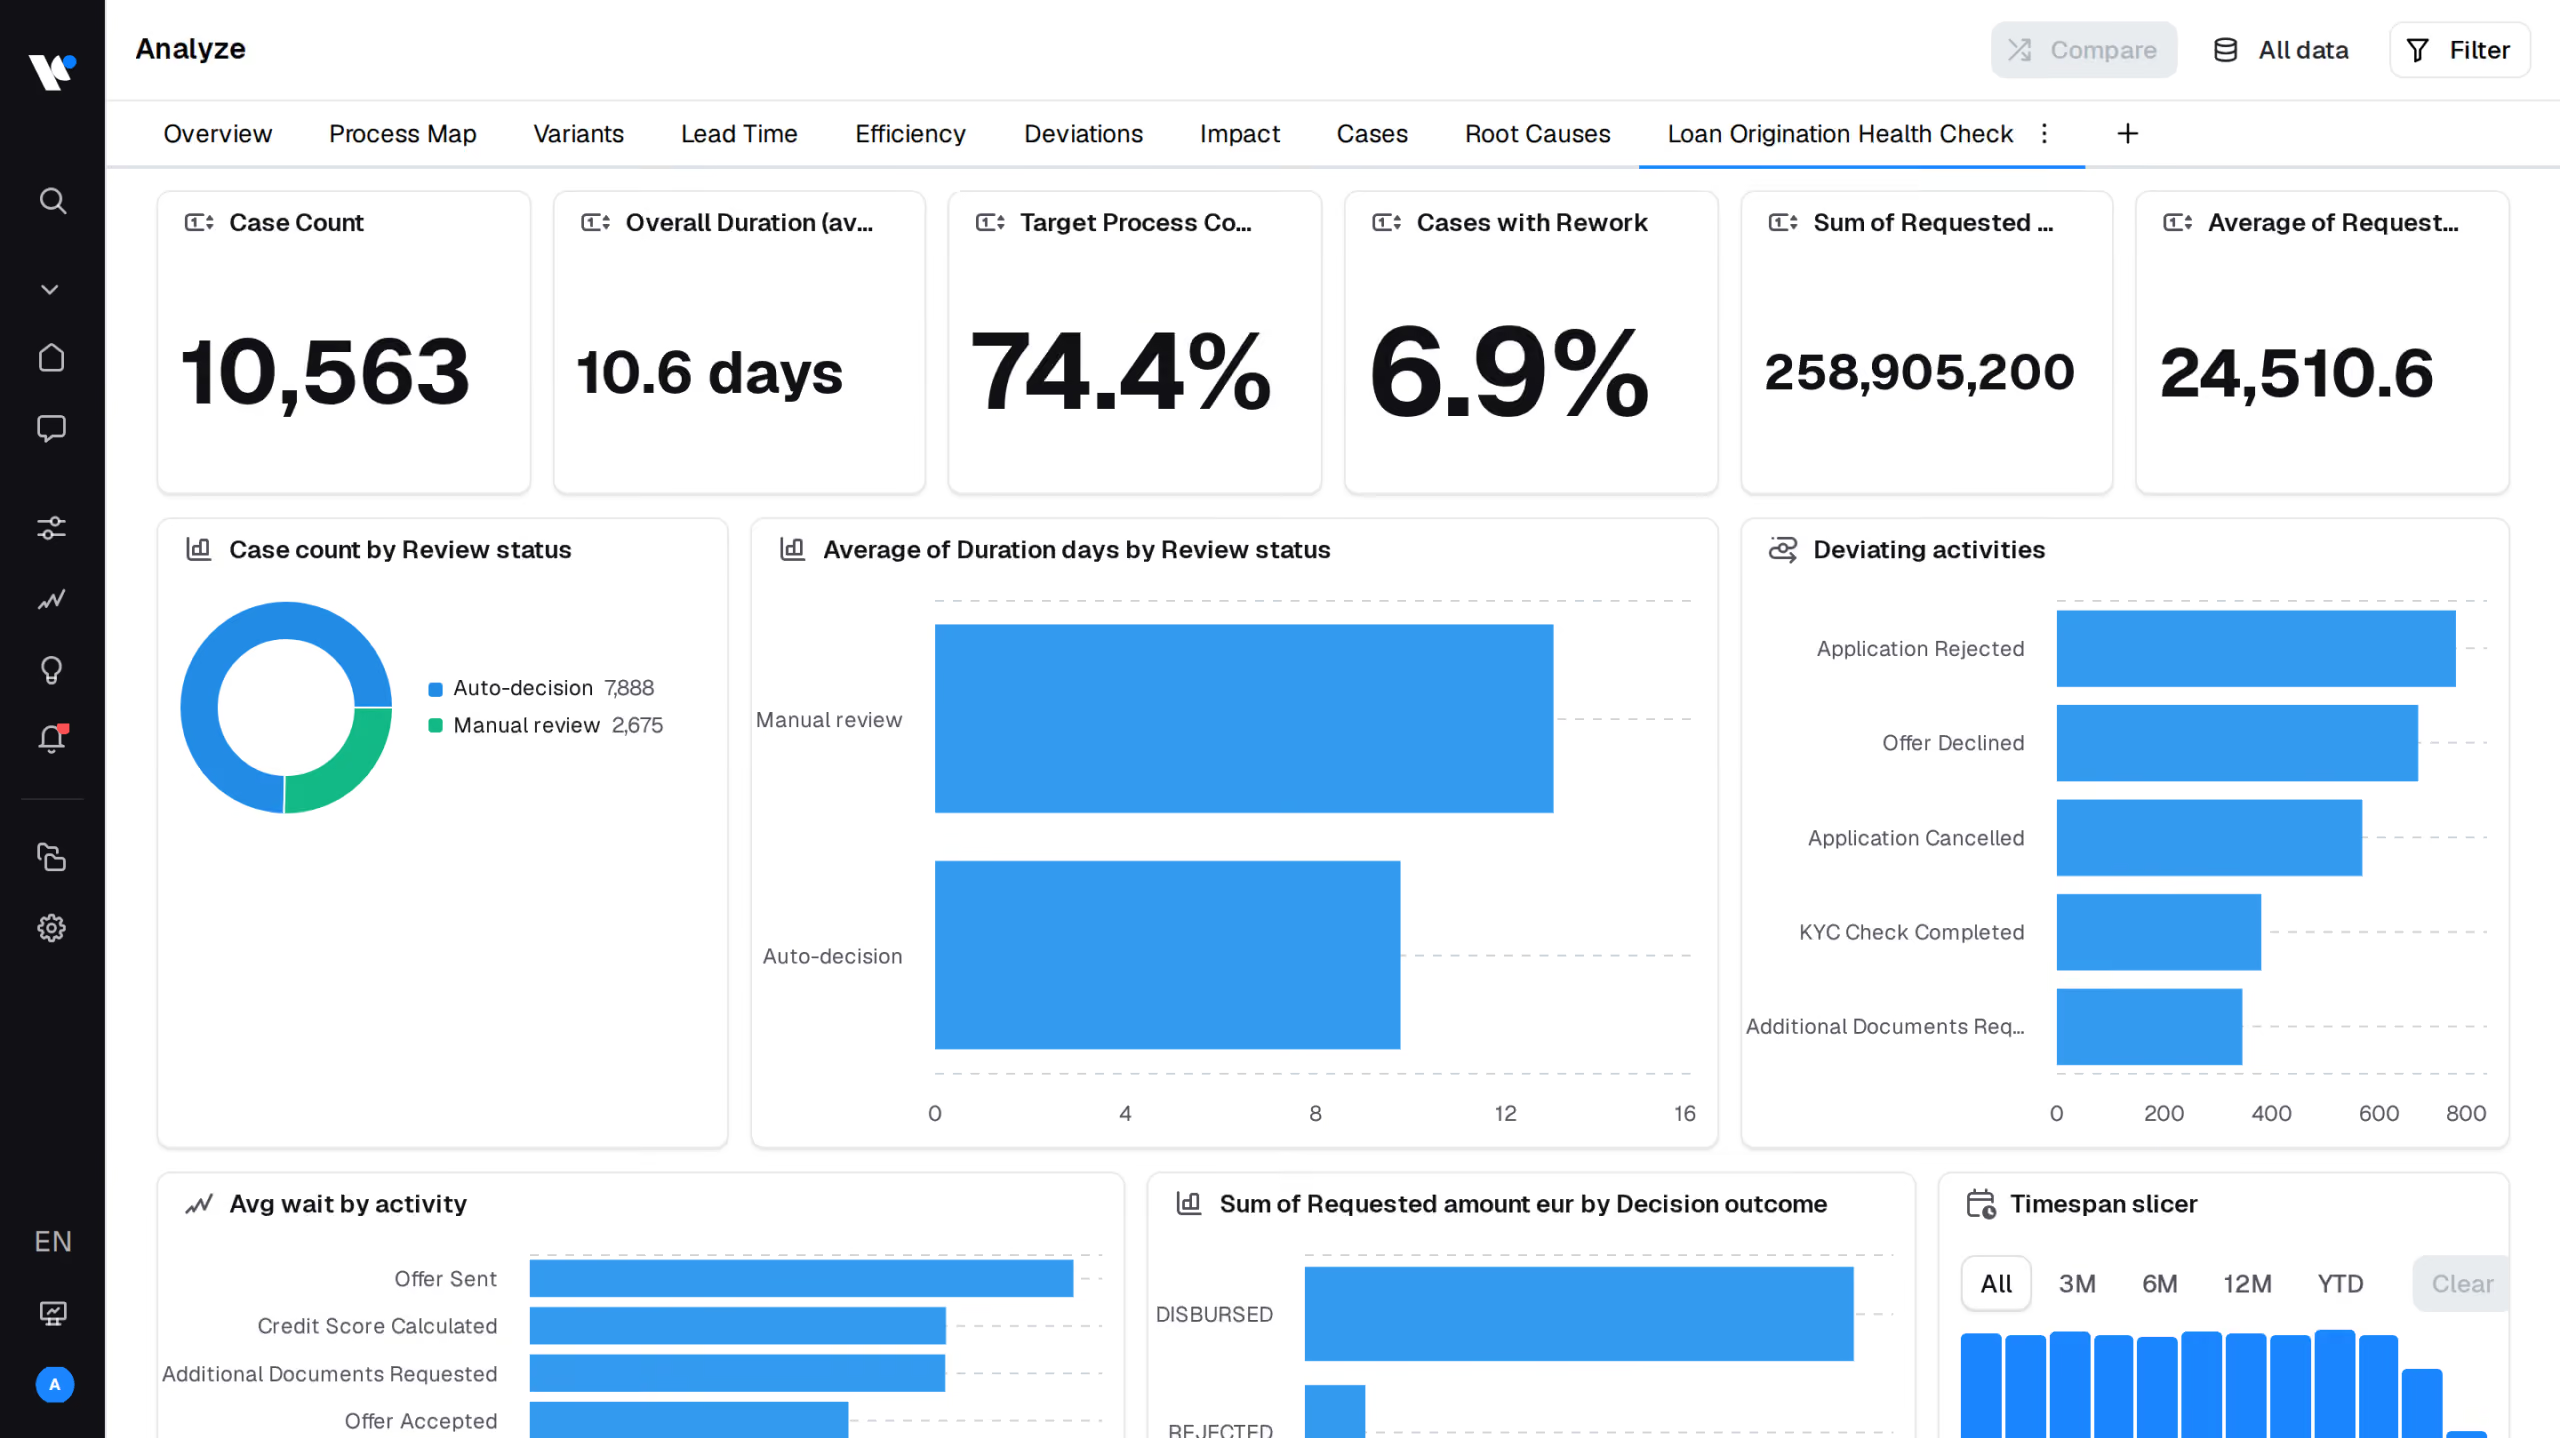
A finished run becomes the data set your Intelligence projects work on, and refreshes the analysis automatically. From there you have Setup, Analysis, Insights, Chat and Alerts on top of it.
Process.Science Intelligence interface with Setup, Analysis, Insights, Chat and Alerts
Get started

See your own machines as a process

Connect one machine or one line, pick a production process and see what comes out. We do it together on your data, so the result is your shop floor and not a sample data set
Runs on your own machine and ERP data
Connects through standard protocols such as OPC UA
No data scientists required
By sending the request, you agree to Process.Science’s Privacy Policy
Thank you! Your submission has been received!
You will receive an E-Mail with a confirmation Link.
Oops! Something went wrong while submitting the form.
Any more questions?

FAQ:Technology & feasibility

The answers IT admins and production managers look for first.
Do we need data scientists for the labelling?

No. The clustering runs automatically. For the labelling you only need the knowledge of the people who run the machines. They tell the system once: when the machine shows this pattern, we call it „set-up“.

We generate terabytes of sensor data. Will our BI system cope?

Yes, because it never sees them. Instead of loading raw curves into Power BI, the IoT Miner pre-processes the data and passes on only the recognised states as a lean event log, for example activity „Fault“, start 14:00, end 14:05.

Which machine and sensor data can we connect?

Time series from your machines and sensors, collected through IoT gateways or SCADA systems and standard protocols such as OPC UA. Typical signals are power, temperature, pressure, speed and vibration.

Do we need the Data Preparation Tool?

To merge machine events with ERP orders, your ERP data has to be available as a clean event log. If you already produce one, the IoT Miner works on its own. We still recommend the Data Preparation Tool, because it handles the merge automatically on every run.

Where does our data live?

Where you want it: on premise, in your own Azure tenant or hosted by Process.Science. Process.Science operates GDPR-compliant and is ISO 27001 certified.

How does the IoT Miner fit together with the rest of the platform?

The Data Preparation Tool builds and maintains the event logs, Intelligence analyses them and the IoT Miner adds machine and sensor data where your process reaches the shop floor. They work together and each one can be used on its own.