Complete Solution for Microsoft Power BI

The Process Mining Suite for your Power BI environment

Turn existing data into solid process insights. We provide you with a full solution:
from high-performance data transformation in your infrastructure to ready-to-use dashboards directly in your Power BI.

The best tool is already open

That is the idea behind the Power BI Suite. Full process mining logic, arriving in the environment your teams use every day instead of asking them to leave it.
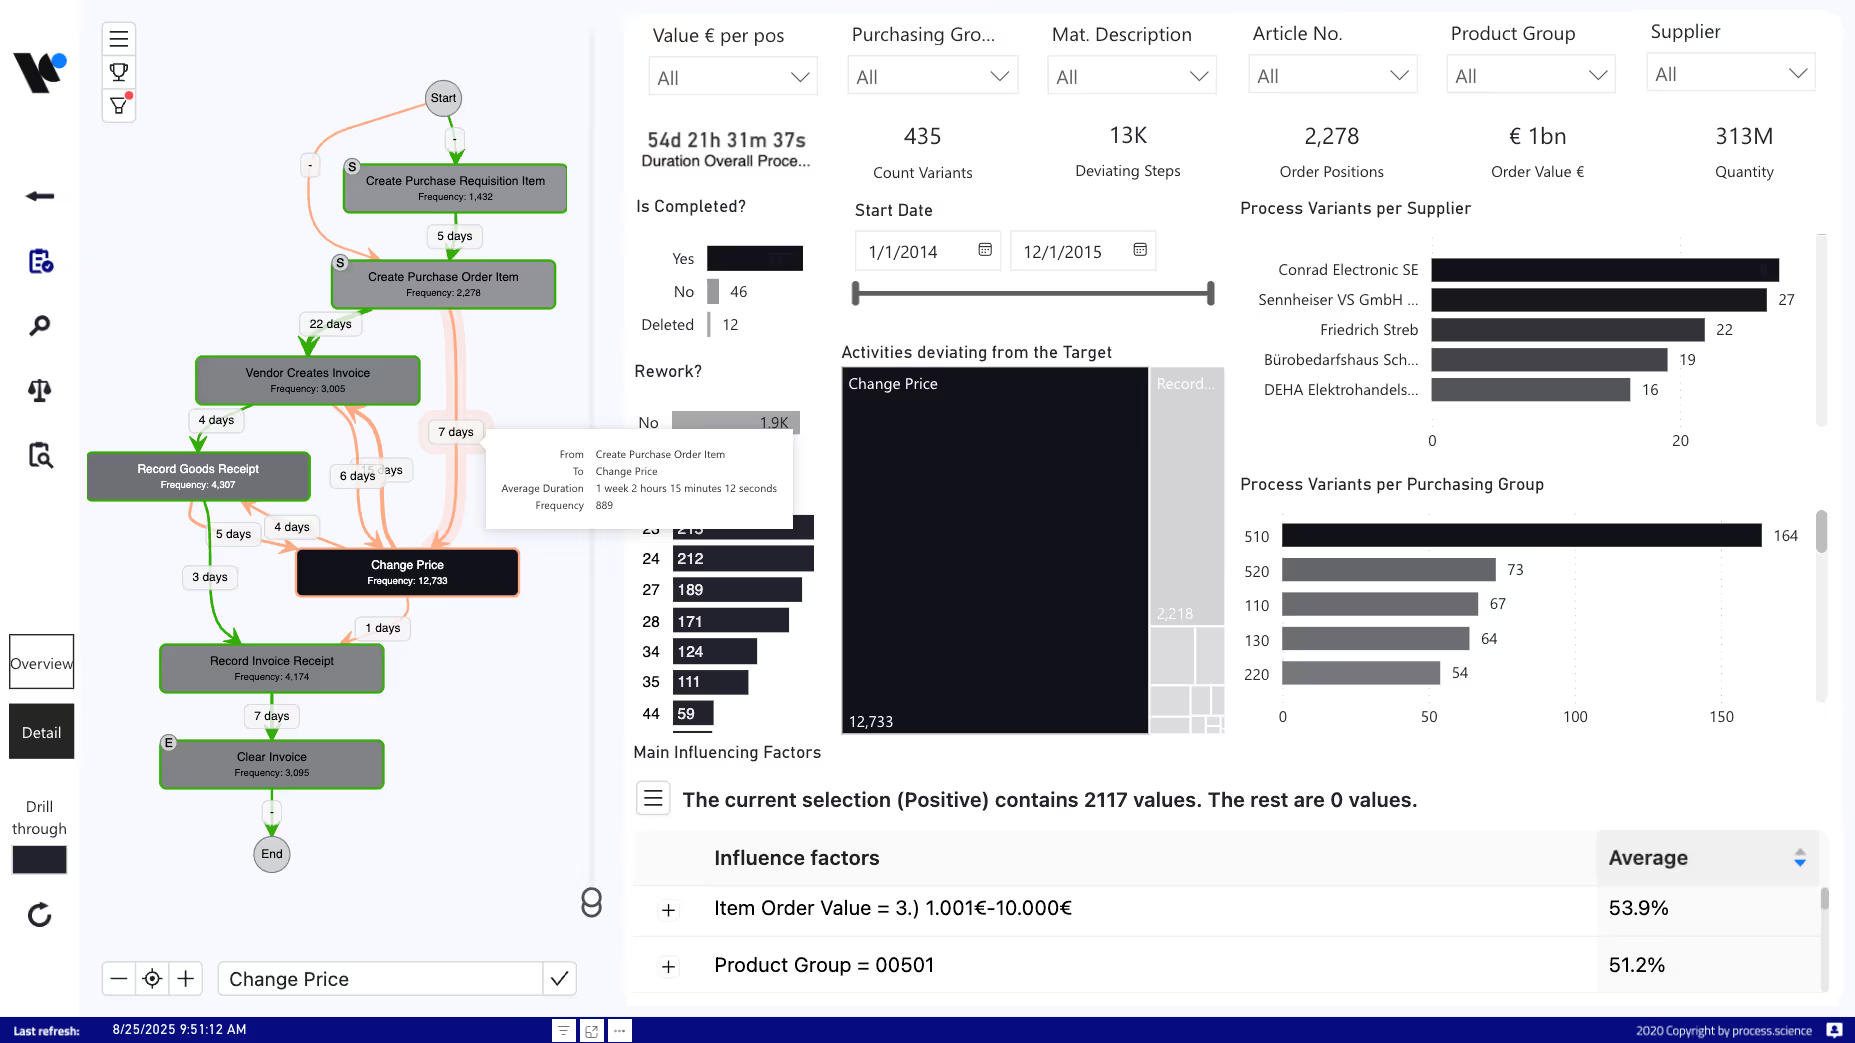
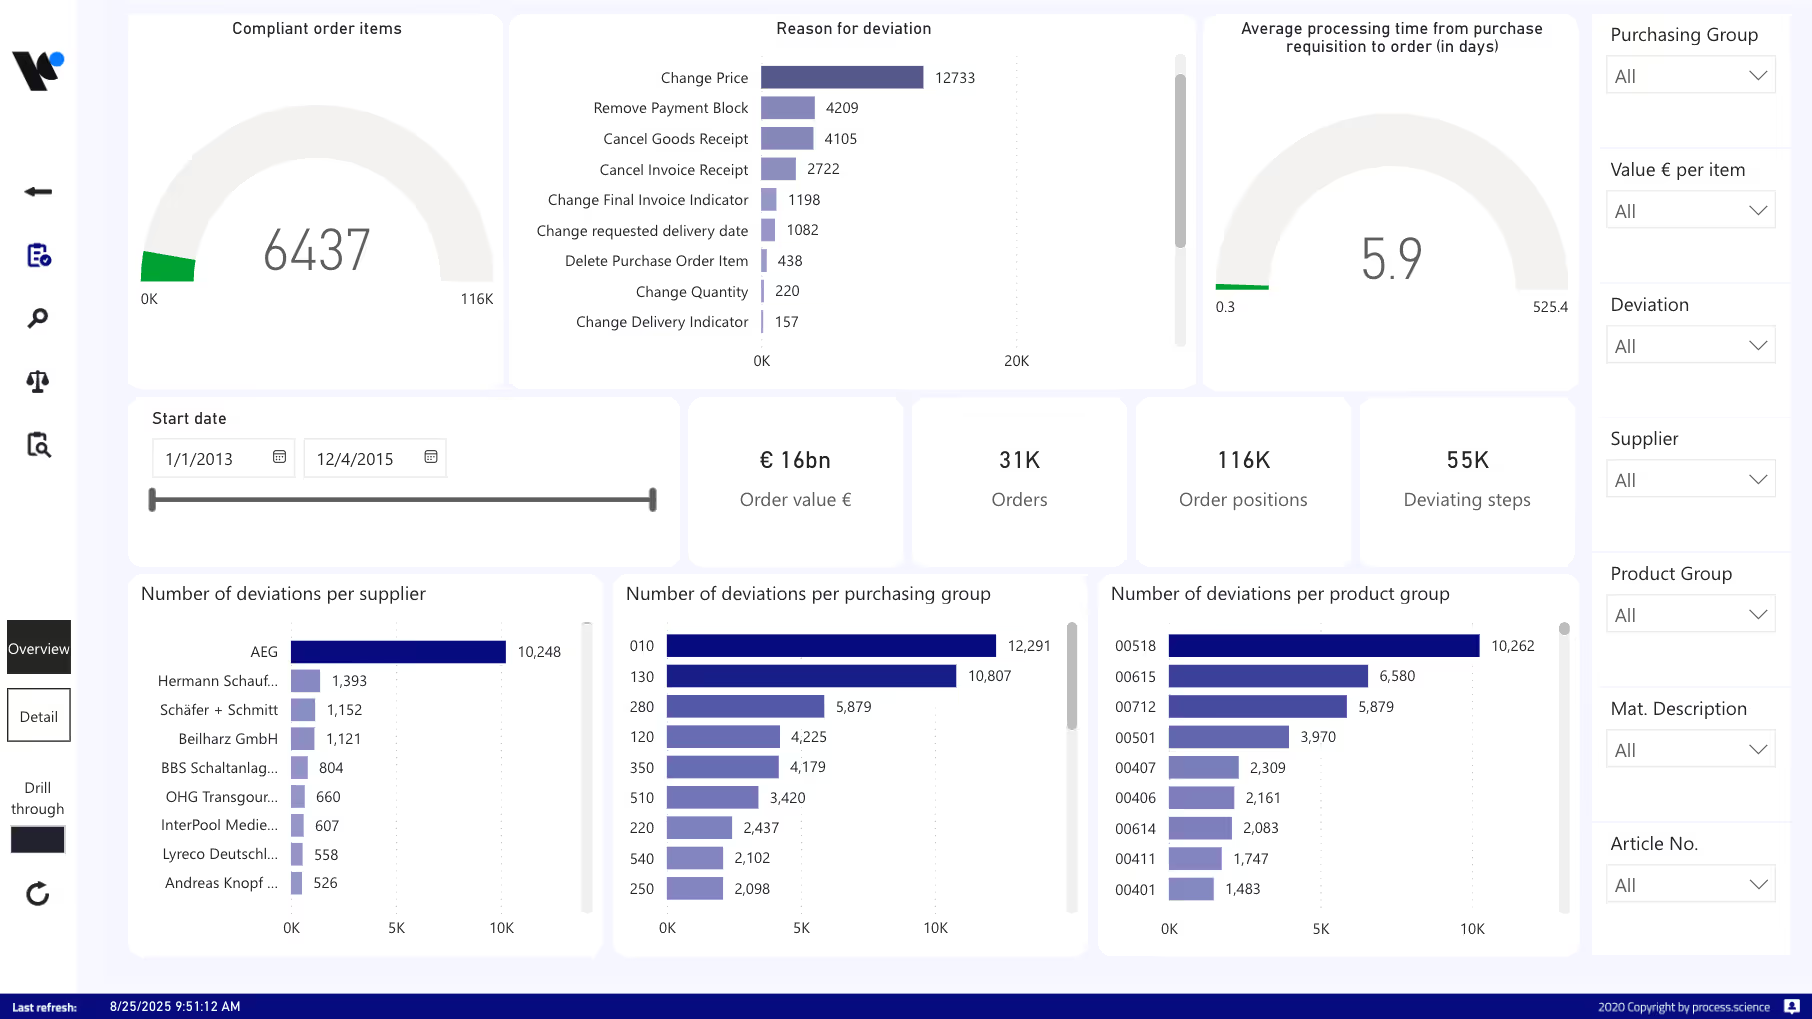
Showing a purchasing process withing a dashboard and root causes for price changes.
A overview of a purchasing process showing deviations and time from requisition to order creation.
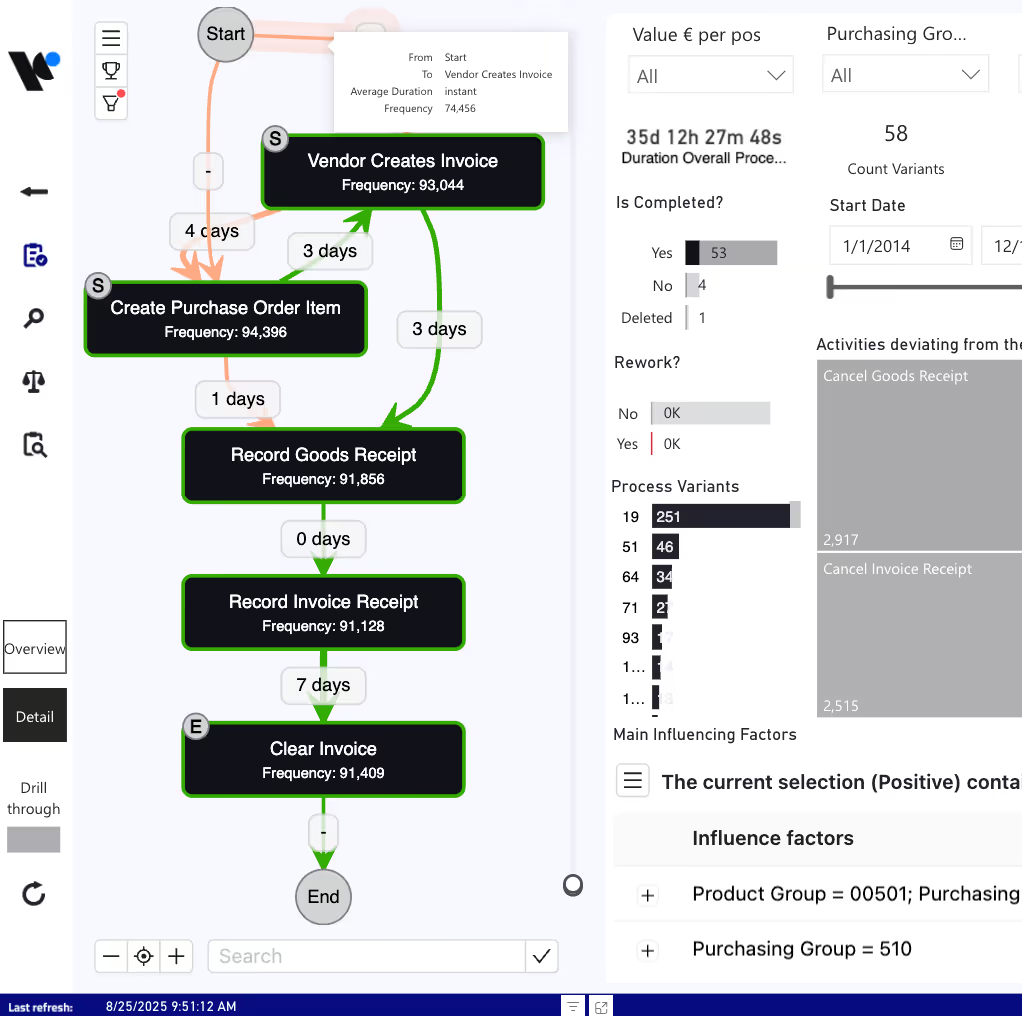
Showing two process graphs comparing the performance in 2014 with 2015.
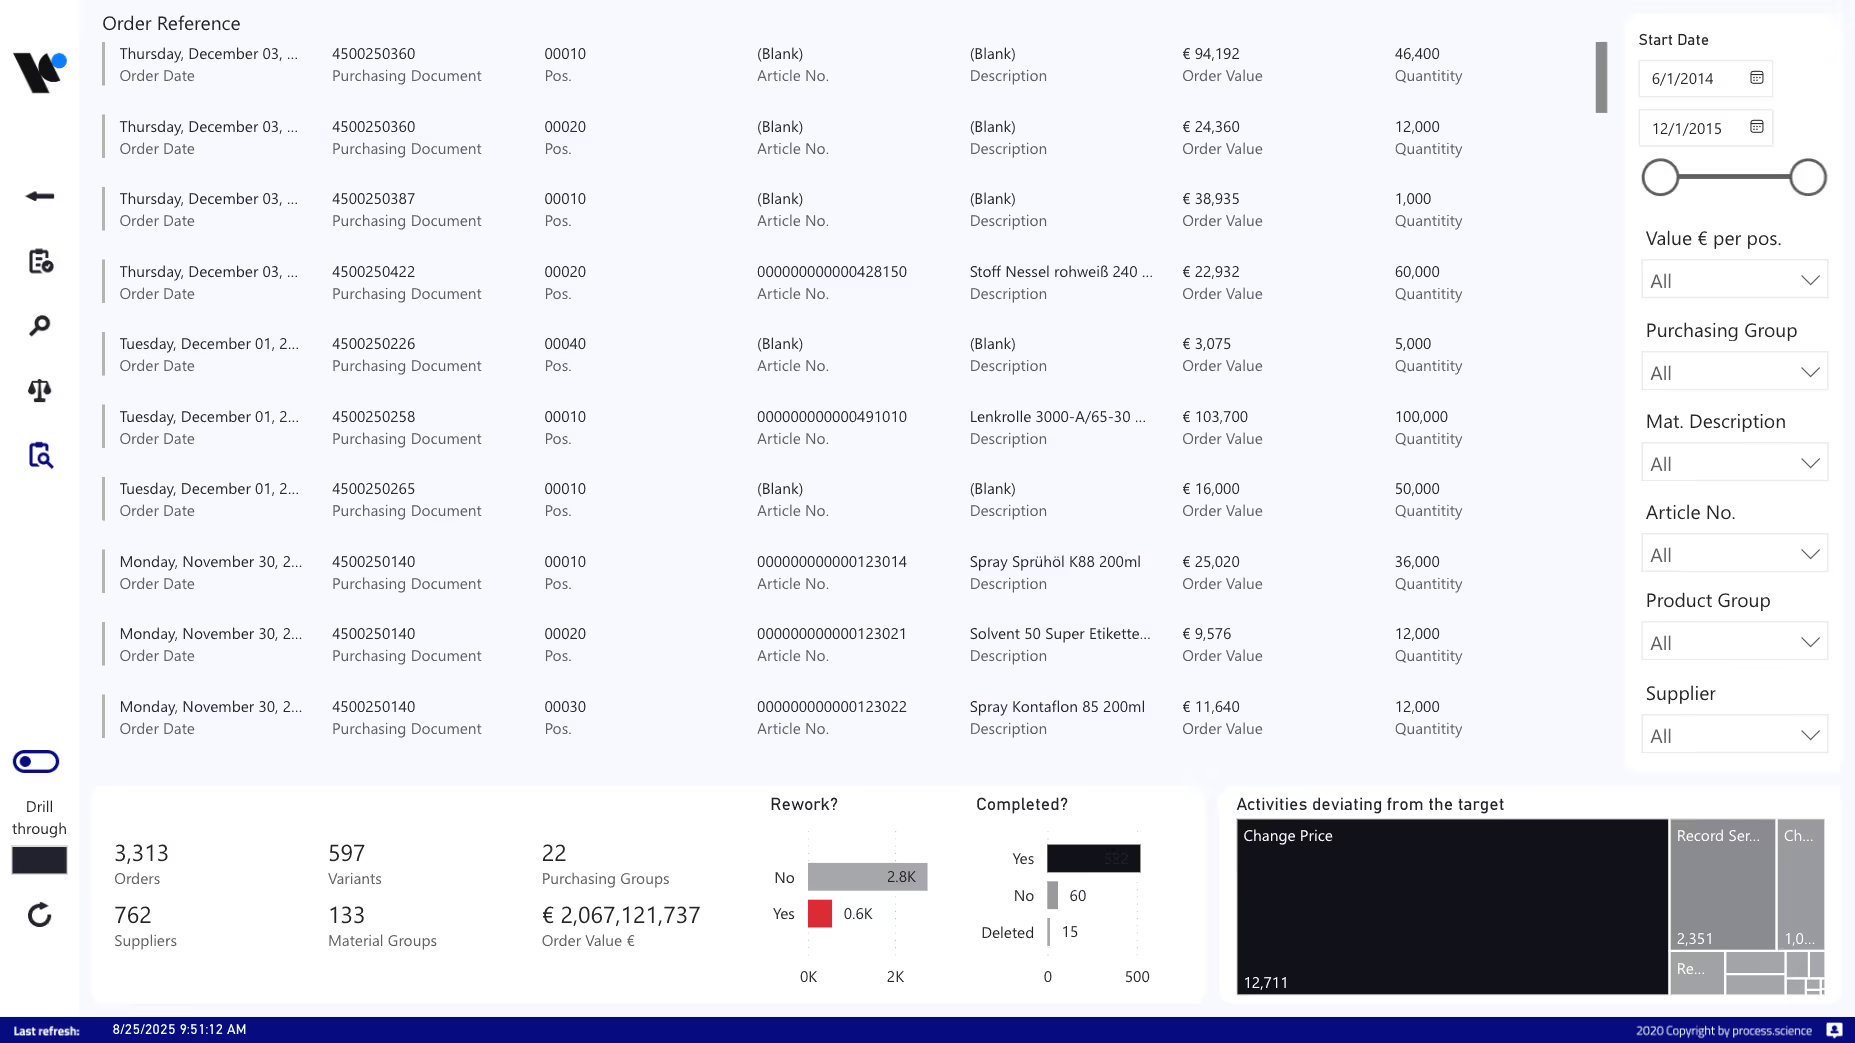
Showing a table with details of all filtered purchase orders.

The "Why" gap in BI

Standard dashboards show you when SLAs have been missed. However, they don’t reveal the actual process flow that caused the delays.

Large projects in the cloud

Classic process mining providers force you into months-long data migrations to expensive, external cloud silos.

Low user acceptance

Forcing departments to leave their familiar Power BI ecosystem drastically reduces acceptance and usage of new tools.
The Process.Science formula

More than BI. Less than a major project.

Classic BI dashboards

Show you metrics and KPIs (e.g., "15% discount missed"). They stop exactly where the interesting question starts.

Traditional Process Mining

Often requires new standalone platforms, complex data migrations to external clouds, and months-long IT implementations.

The integrated complete solution

We close this gap. We bring full process mining logic through proven dashboards and dedicated data transformation directly into your infrastructure – without system breaks.
Not using Power BI or looking for a fully independent AI platform?

Not a blank canvas, but a working system

You don't get one visual and a manual. You get the transformation layer, the report templates, and the analysis logic, fitted to your IT and to the people who will actually use it.
Out-of-the-Box Value

Dashboards that work on day one

Don't start from scratch. We bring complete Power BI report templates for your key core processes.
Proven templates: Purchase-to-Pay (P2P), Order-to-Cash (O2C), or ITSM. Each one carries the best practices of hundreds of projects, not a demo dataset.
Cross-filtering that just works: The process graph is the centre of the report. Click a bottleneck and every surrounding visual, table and KPI filters with it.
Yours to extend: Your BI developers can take any template apart, add measures and fold it into existing management reporting.
A process graph showing maverick buying within a purchasing process.
Process graph with purchasing KPIs.
High-performance architecture

Data transformation within your infrastructure

The heavy computation doesn't happen in the reporting. We efficiently prepare the event logs before visualization – directly in your own database (e.g., SQL Server, Azure).
Reports stay fast: Since the logic and transformations run close to your system infrastructure, your Power BI reports remain extremely fast and resource-efficient.
Your DAX logic remains intact: Seamlessly connect the prepared process data with your existing star schema and use your established measures.
Row-Level Security (RLS): Since everything stays within your model, your already defined access rights apply automatically.
In-depth analysis

From the big picture to root cause analysis

Give your analysts the tools to not only view processes but to identify the true cost drivers.
Conformance checking: Upload your target processes (BPMN) into the dashboard and let Power BI automatically calculate how often and where deviations occur.
Dynamic level of detail: Zoom smoothly from the 10,000-foot overview (the "happy path") down to the most granular process variants.
Action-driven: Thanks to Microsoft integration, trigger Power Automate flows directly from the dashboard when critical thresholds are crossed.
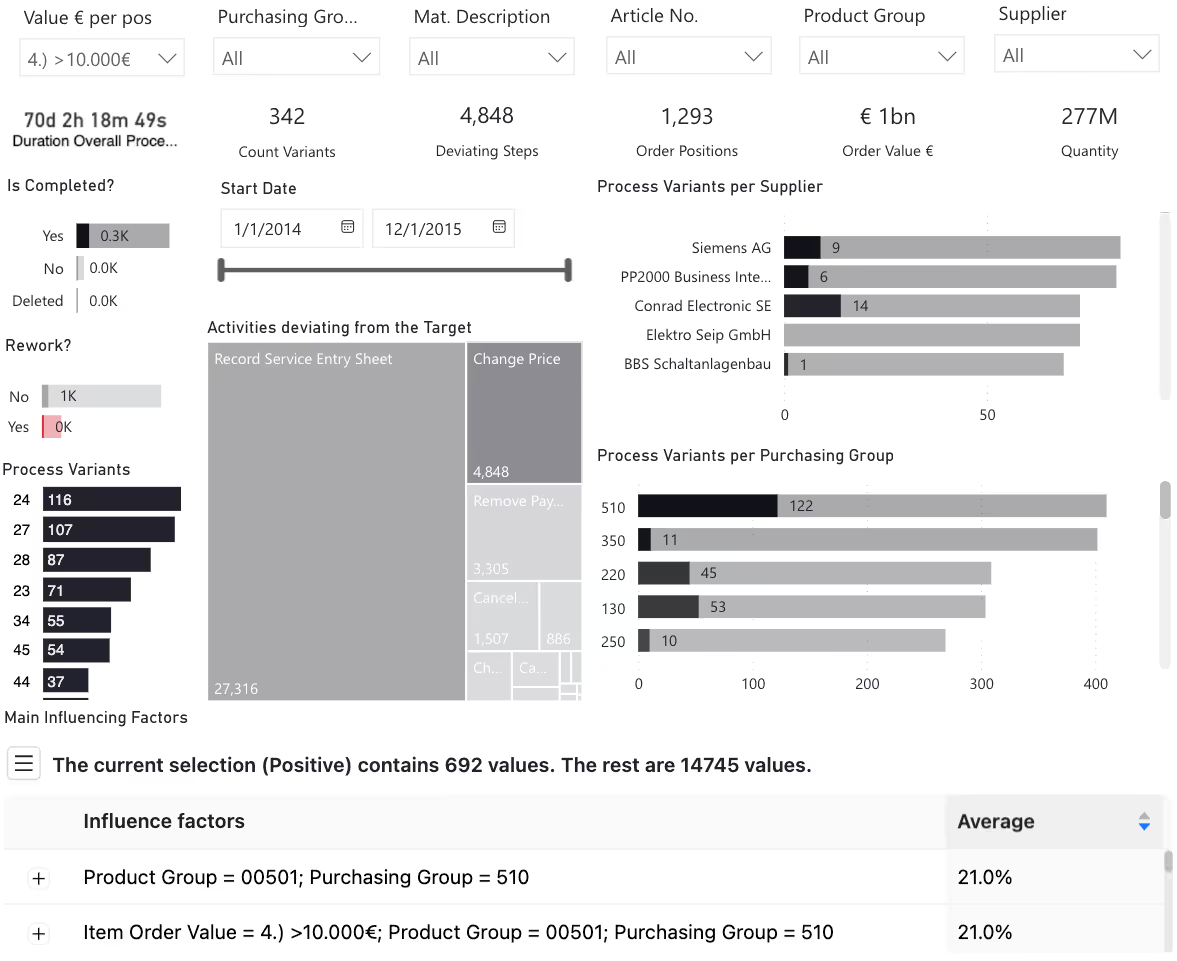
Dashboard showing the detailed root causes of changes in the process.
Security by Design in Azure

Every CISO's dream: Absolute data sovereignty

Process mining initiatives often fail due to IT security concerns because highly sensitive ERP data must be transferred to a third-party cloud. With the Process.Science complete solution, your data stays exactly where it is safe: within your company firewalls and your Microsoft ecosystem.

No external clouds

Neither data transformation nor dashboard calculations require exporting to external systems.

Governance remains intact

You retain full control over your Power BI workspaces, apps, and Microsoft Entra ID (formerly Azure AD) permissions.

Microsoft Certified

Our custom visuals undergo strict security audits and are approved for enterprise use.
The architecture

How we integrate into your data landscape

No black box. See step-by-step how we build interactive process mining dashboards in your Power BI from raw ERP data – 100% within your infrastructure.

01. Data extraction (ELT/ETL)

We pull the required raw tables via standard connectors (OData, REST, direct SQL queries) from your source systems (e.g., SAP, Dynamics) and load them into your company-owned staging database (e.g., Azure SQL, MS SQL Server).

02. Data transformation (SQL)

From millions of isolated raw data points, a seamless, chronological process flow (production order, station, timestamp) is generated.

03. Power BI data model

The transformed event logs are loaded into the Power BI data model (DirectQuery or import mode). Here, we link the process data with your existing dimension tables (star schema) like master data, cost centers, or employees.

04. Visualization & DAX

In the final step, you load our certified custom visual into your Power BI report. You apply your familiar DAX measures and create interactive dashboards that can be shared immediately with departments via the Power BI service (while respecting your RLS).
30 days full of insights

Installation in 24 hours

Start your proof of concept without lengthy IT projects. We implement the solution within one day in your environment. Then you have a full 30 days to extensively validate the benefits and dashboards using your own process data.
Licenses for 5 concurrent users
16 hours expert support & workshops
Your own data, your own environment
By sending the request, you agree to Process.Science’s Privacy Policy
Thank you! Your submission has been received!
You will receive an E-Mail with a confirmation Link.
Oops! Something went wrong while submitting the form.
Any more questions?

Technical FAQs

The most important answers for BI developers and Power BI administrators.
Do we need additional server infrastructure for Process.Science?

No, you don't need a completely new infrastructure. The data transformation (ELT) runs resource-efficiently on your existing SQL database (e.g., Azure SQL, MS SQL Server). Visualization and analysis take place entirely within your existing Power BI environment using our custom visuals. There is no hidden process.science cloud.

What data format do you require to get started?

To start Process Mining, we generate an event log from your source systems. Essentially, this is a flat table with three mandatory core columns:

1. Case ID (e.g., an order number)
2. Activity Name (e.g., "Invoice approved")
3. Timestamp (e.g., "2026-03-20 14:30:00")

All other metadata (user, department, invoice value) can be linked via standard Power BI relationships in a star schema.

Does the solution work with Power BI Pro or do we need Premium/Fabric?

Our complete solution works perfectly with Power BI Pro, Premium per User (PPU), and Premium capacities (Microsoft Fabric). Since we offload the compute-intensive data transformation to your SQL database, Power BI remains performant regardless of your license level.

Can we also use the system on-premises (Power BI Report Server)?

Basically, yes. Our visual is compatible with Power BI Report Server for pure on-premises scenarios. However, since Microsoft sometimes uses older versions of the visual engine there, we gladly check compatibility with your specific server version before a PoC.

How does Row-Level Security (RLS) work?

Because our dashboards and visuals integrate seamlessly into the Power BI data model, all your existing RLS rules apply automatically. If a purchaser is only allowed to see data for Plant A, the process graph automatically renders only the process flow for Plant A. No duplicate rights maintenance is needed.