Solutions for production and manufacturing

See exactly where your production is losing time

Unplanned downtime, shifting bottlenecks, and missed delivery dates cost the industry billions. Make rework loops, throughput blockers, and OEE losses visible in real time – directly in Power BI, Microsoft Fabric or our platform
The reality in unoptimized production lines
95%
of the entire manufacturing lead time is actually pure waiting and idle time between work steps.
15–20%
On average, companies lose a portion of total revenue due to the "Cost of Poor Quality" (rework and scrap).
55–60%
Is the average global Overall Equipment Effectiveness (OEE), far from the world class standard of 85%.

Your Production Dashboards in Action

We transform complex MES and ERP logs into an interactive control tool. Uncover your true cost drivers, directly in Power BI, Microsoft Fabric or our platform.
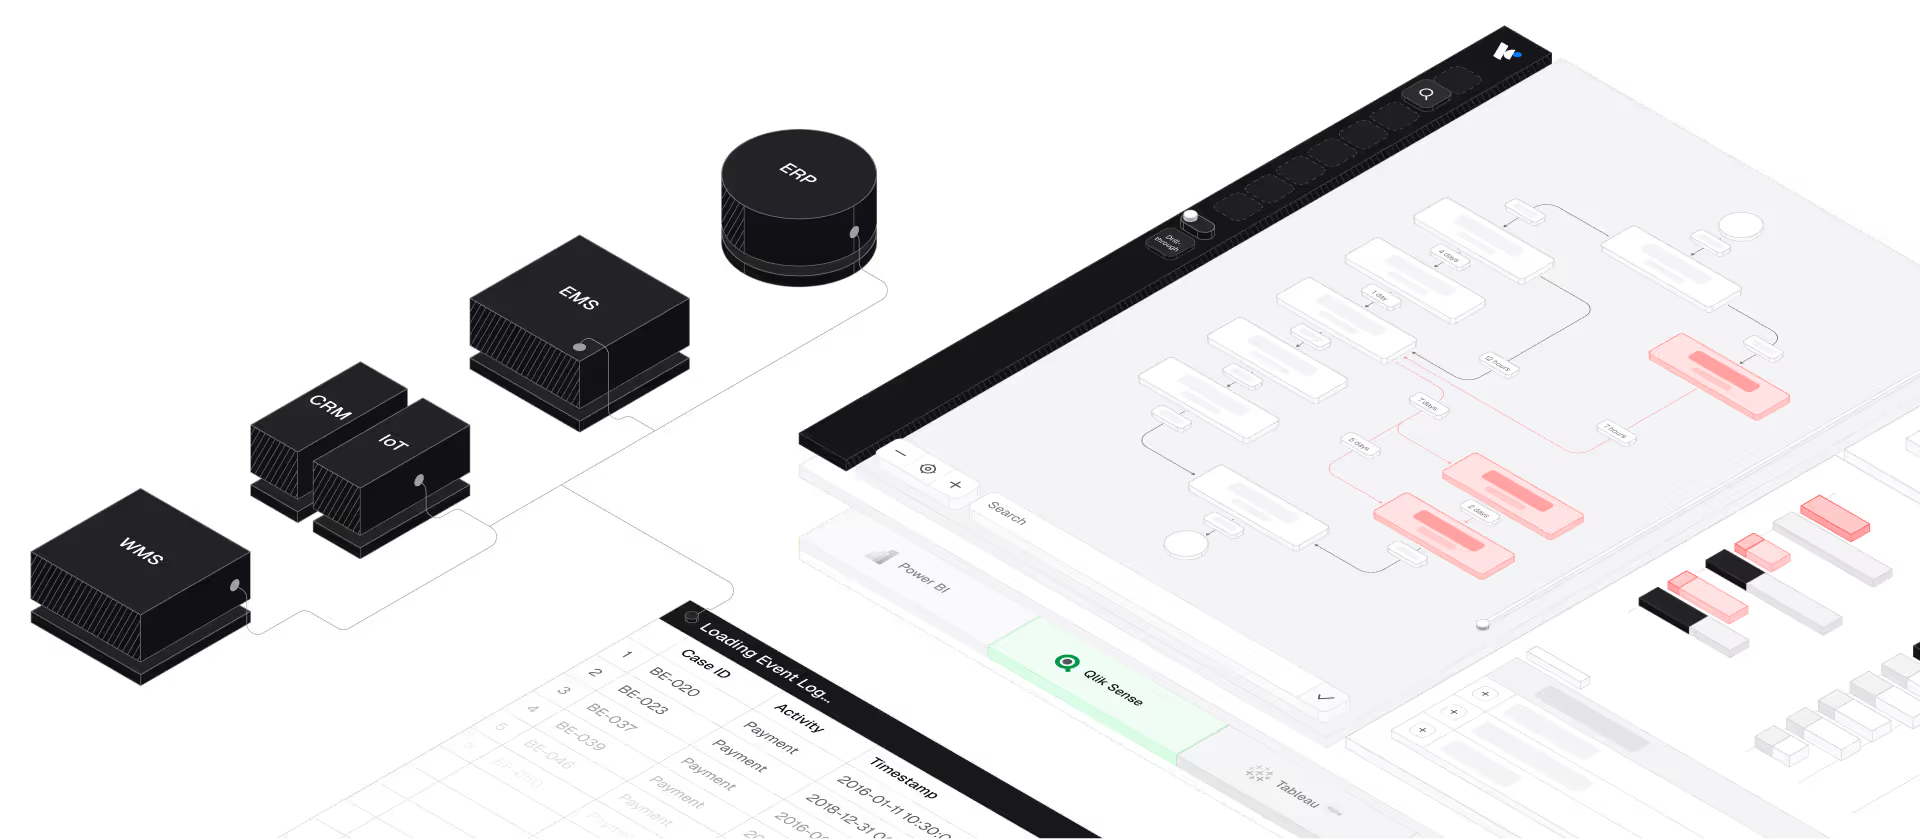
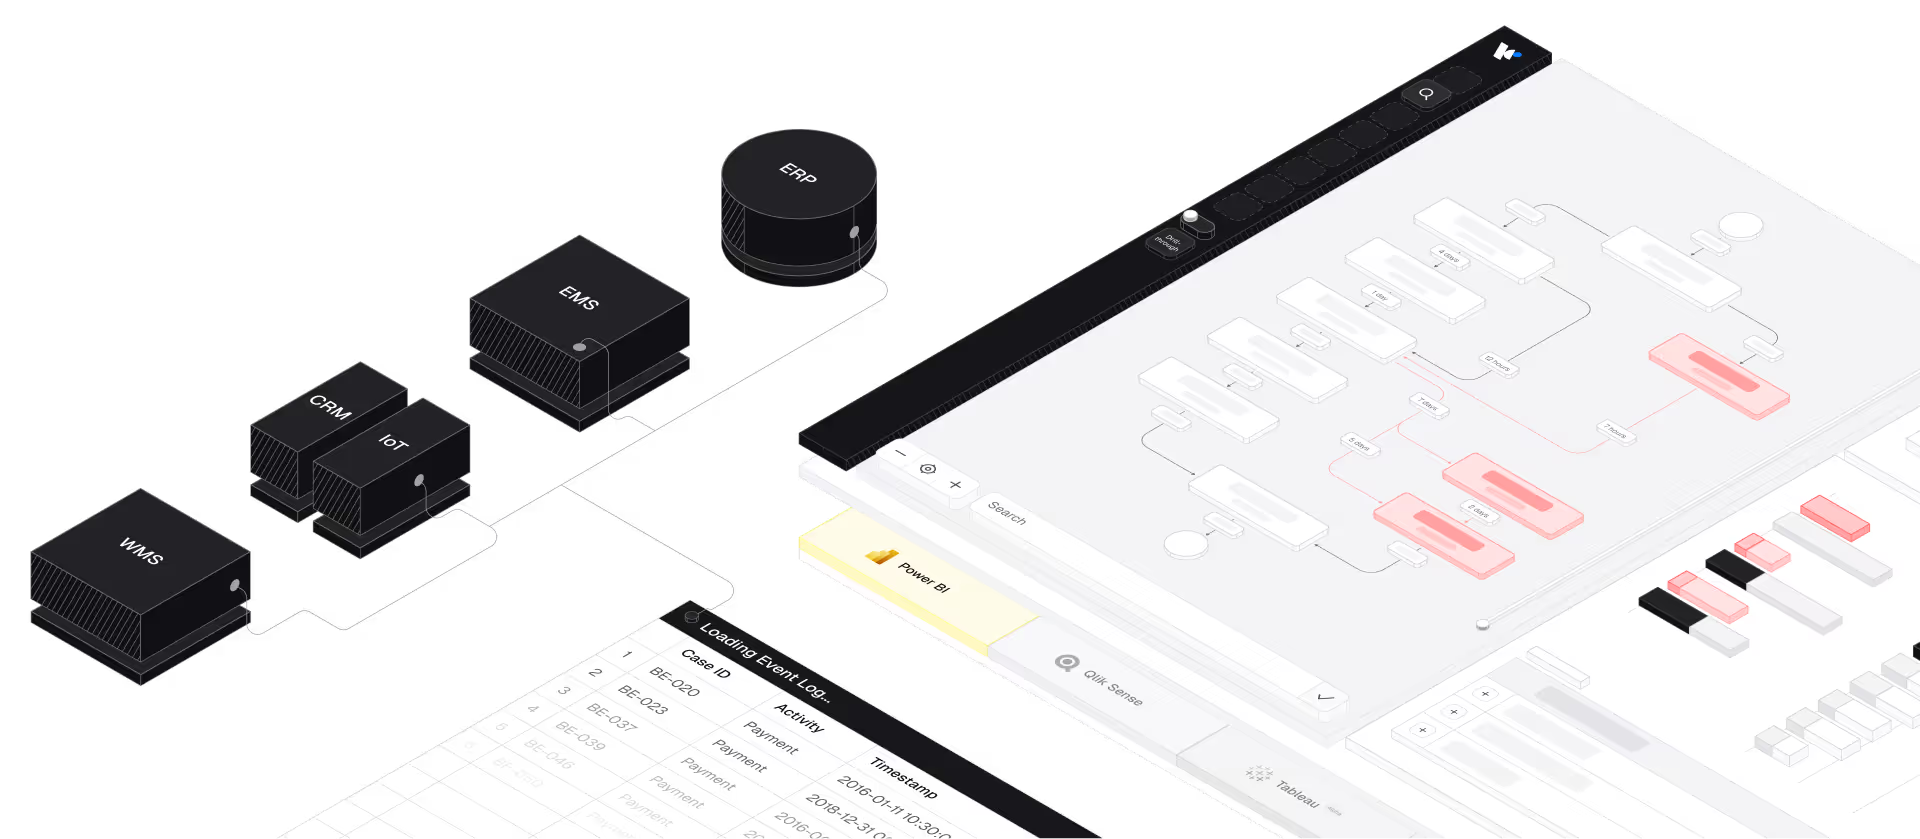
Diagram showing interconnected software modules labeled WMS, CRM, IoT, EMS, and ERP linked to a digital dashboard displaying flowcharts and data tables in business intelligence platform Power BI.
Diagram showing interconnected software modules labeled WMS, CRM, IoT, EMS, and ERP linked to a digital dashboard displaying flowcharts and data tables in business intelligence platform Qlik Sense.
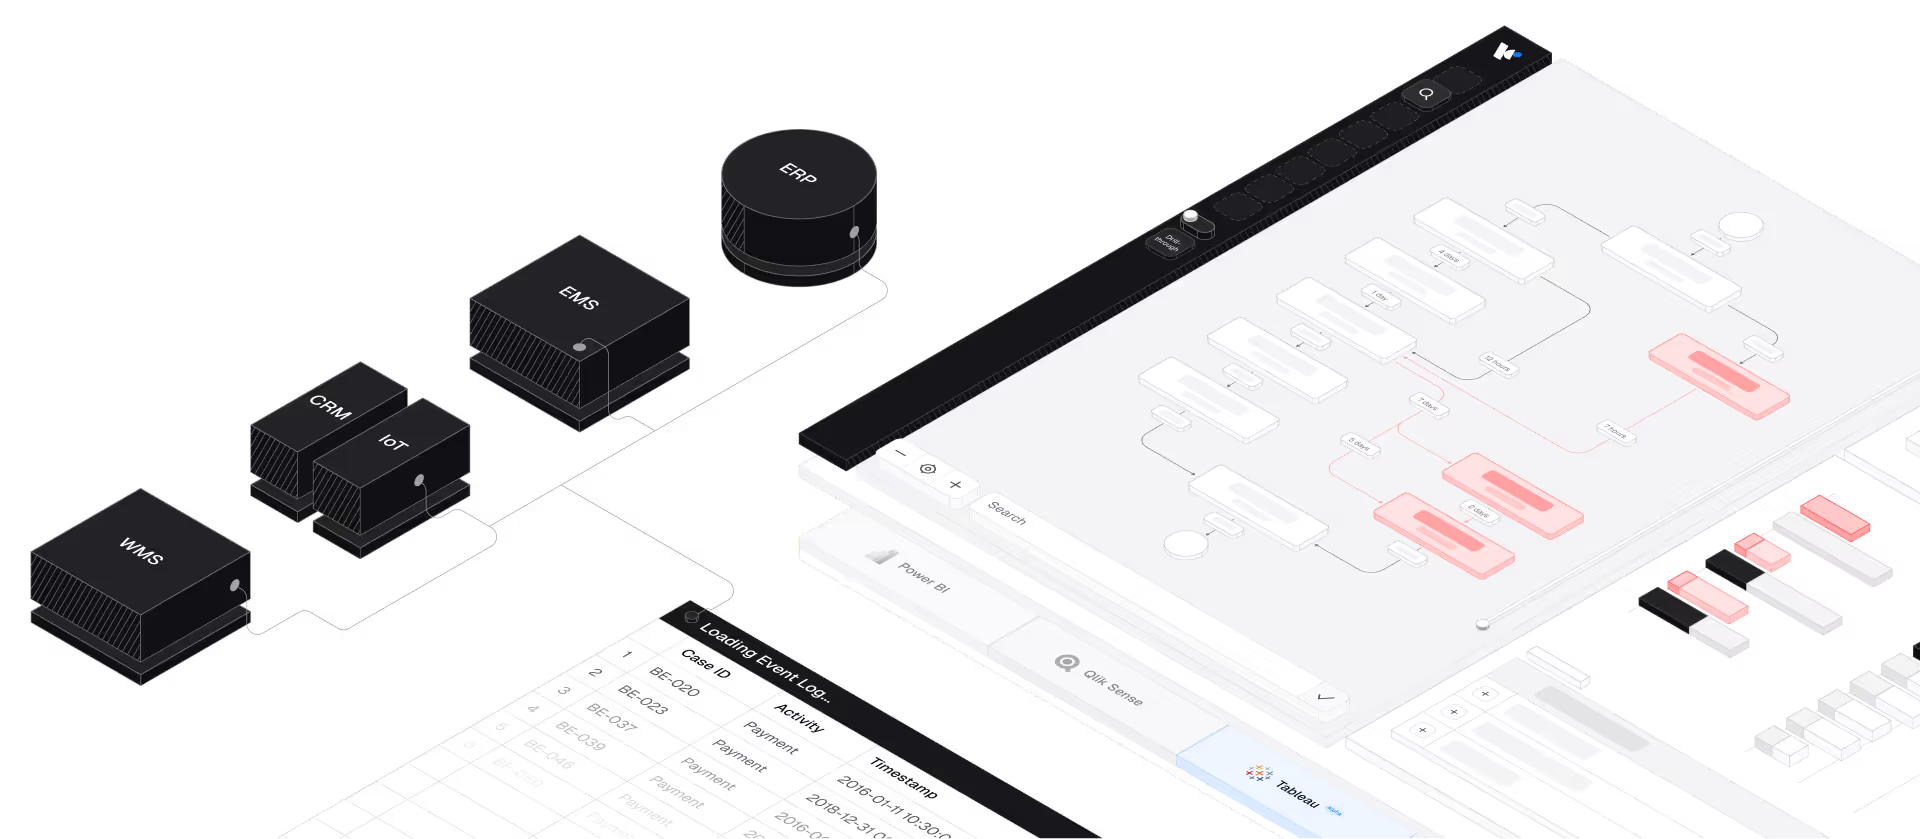
Diagram showing interconnected software modules labeled WMS, CRM, IoT, EMS, and ERP linked to a digital dashboard displaying flowcharts and data tables in business intelligence platform Tableau.
Throughput & OEE

Locate shifting bottlenecks

Traditional methods like Value Stream Mapping are static. In reality, bottlenecks shift every minute. Optimizing the wrong bottleneck wastes effort and your OEE stagnates.
Real-time identification: The algorithm shows you exactly where material (WIP) is currently piling up before a machine.
Root cause analysis: See at the push of a button whether setup times, short-term failures, or material shortages are causing the backlog.
Throughput boost: On average, our customers reduce their bottlenecks by 43% and significantly increase their OEE.
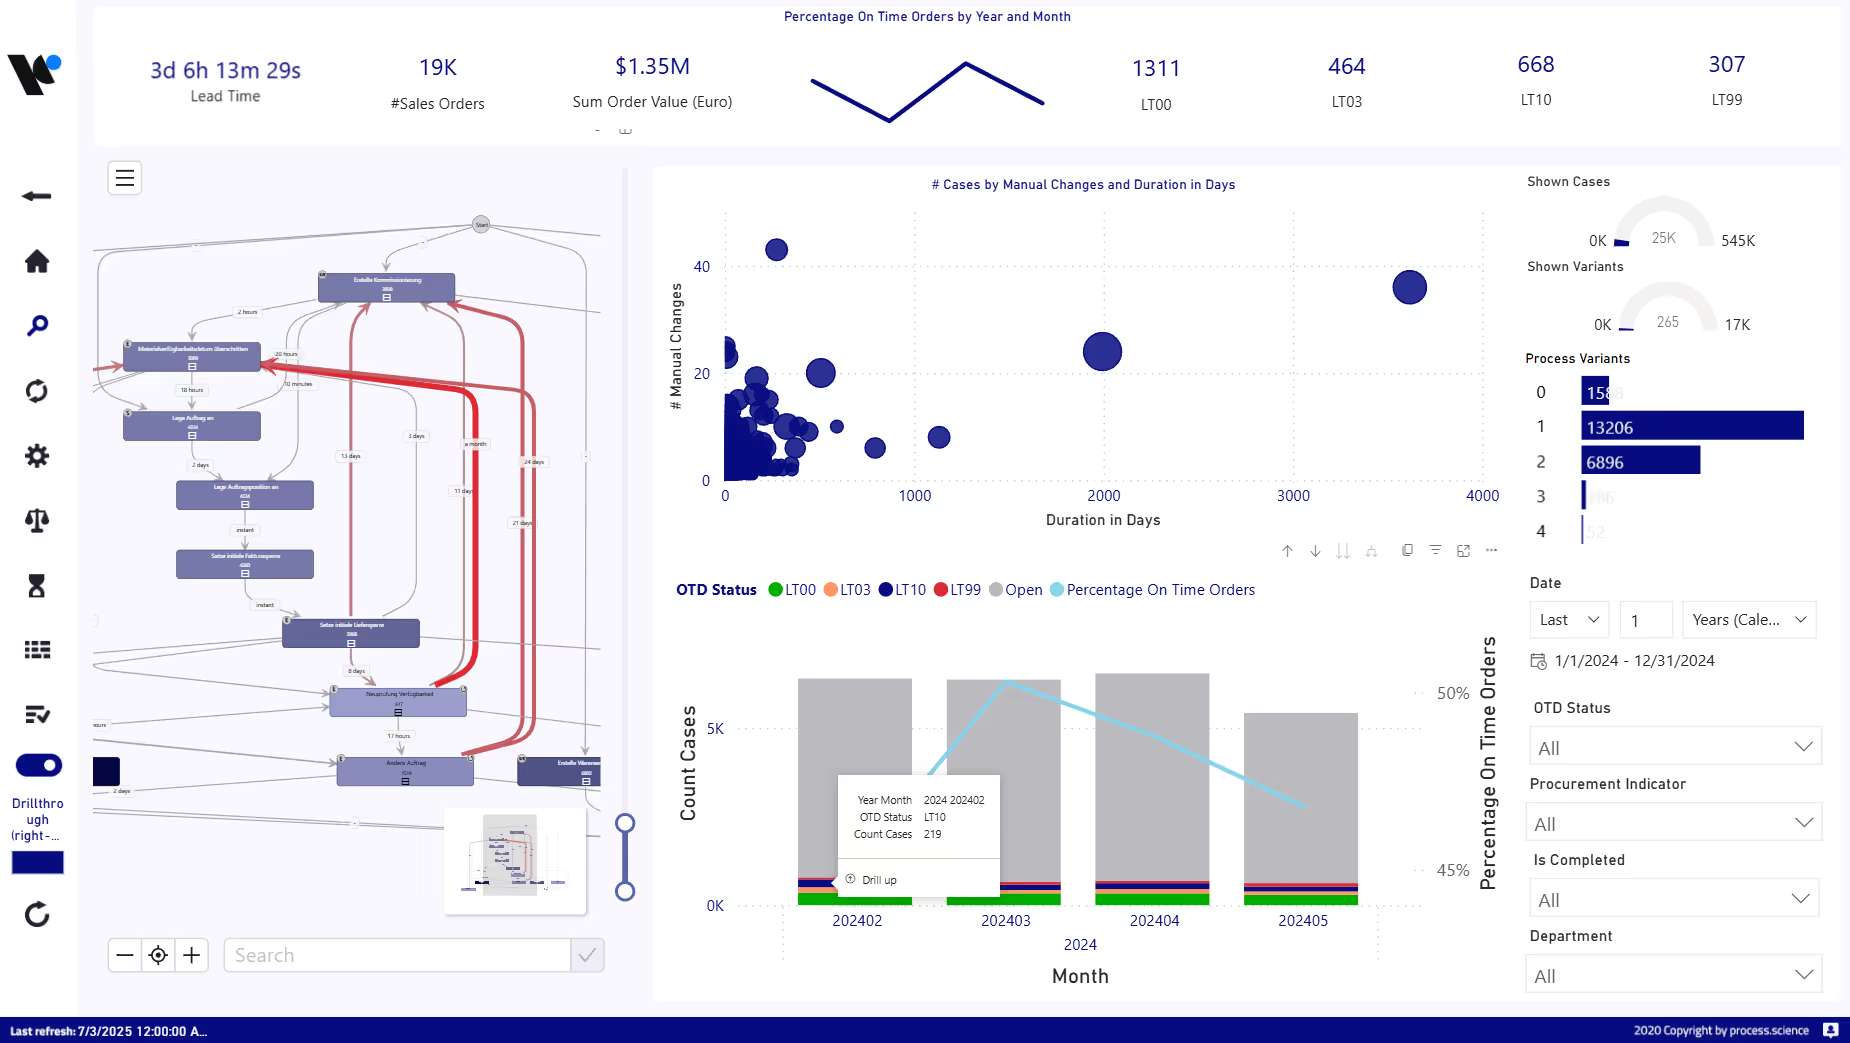
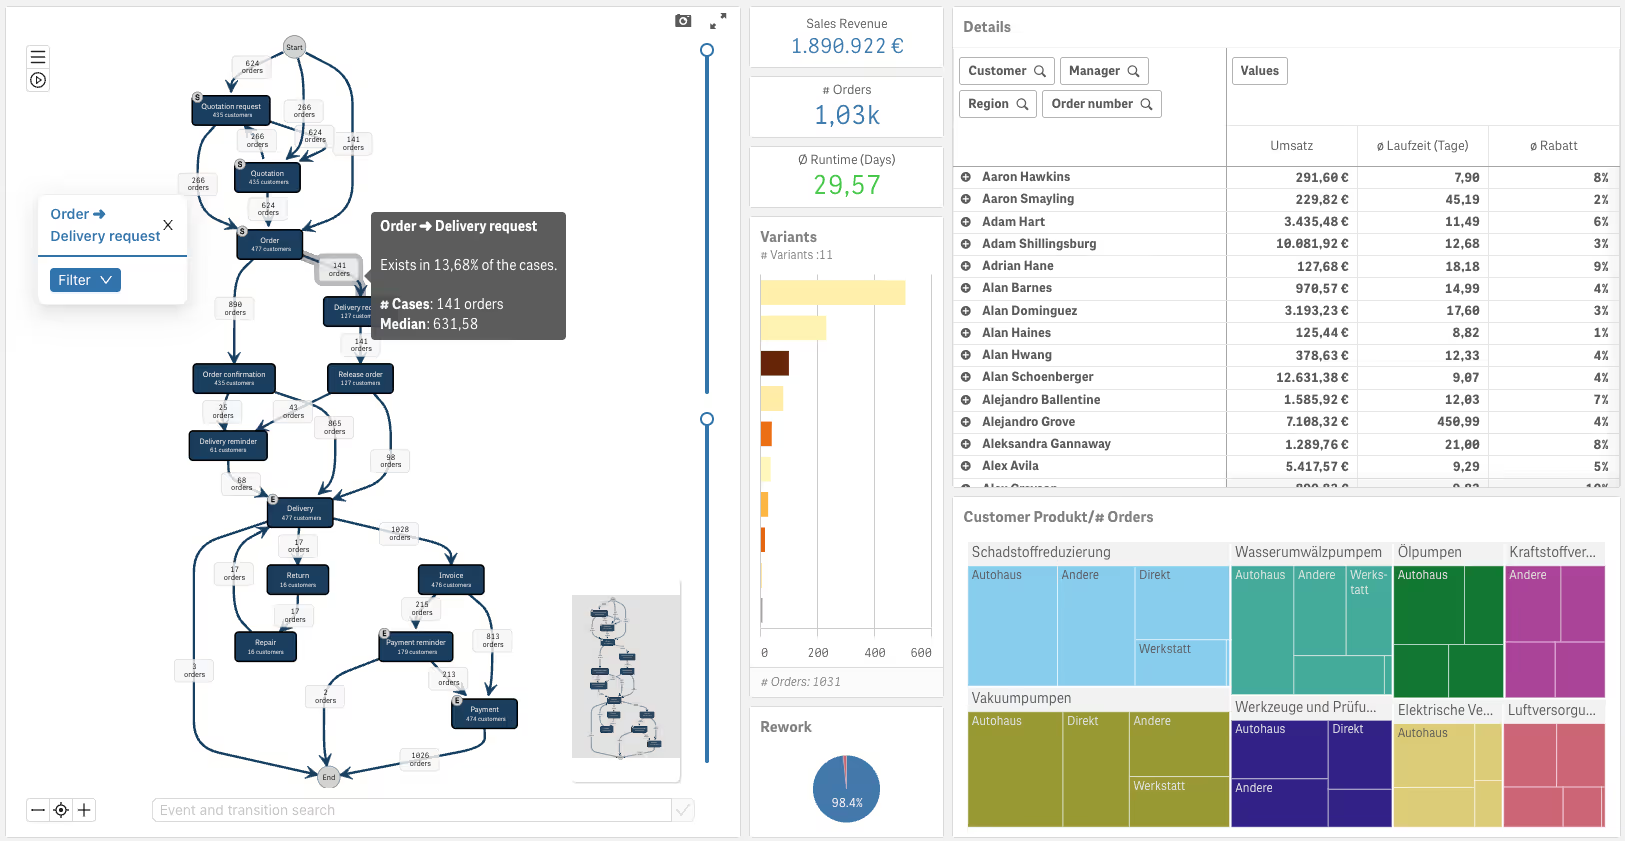
Process.Science Order Management Detailed View Dashboard with rework and Reliability Groups.
Quality Management (COPQ)

Radically shorten rework loops

Even with a high First-Pass Yield (FPY) per station, errors accumulate: up to 40% of all parts often require at least one rework. Each rework step massively increases unit costs.
Conformity check: The system continuously compares the planned work schedule with the actual production paths.
Pattern recognition: Precisely identify the process variants or machine types that statistically cause the most scrap.
Reduce costs: Cut your rework time by up to 52% and protect your margins.
Order-to-Cash & Logistics

Guarantee on-time delivery (OTIF)

Penalties for late deliveries often consume up to 50% of the order value. 69% of B2B customers do not reorder after a significant delay.
O2C monitoring: Track orders seamlessly from entry through approval to shipping readiness.
Early warning system: Detect potential delivery delays during order processing, not just at shipping.
Manual blockers: Identify incorrect order entries that trigger costly rework loops in inside sales.
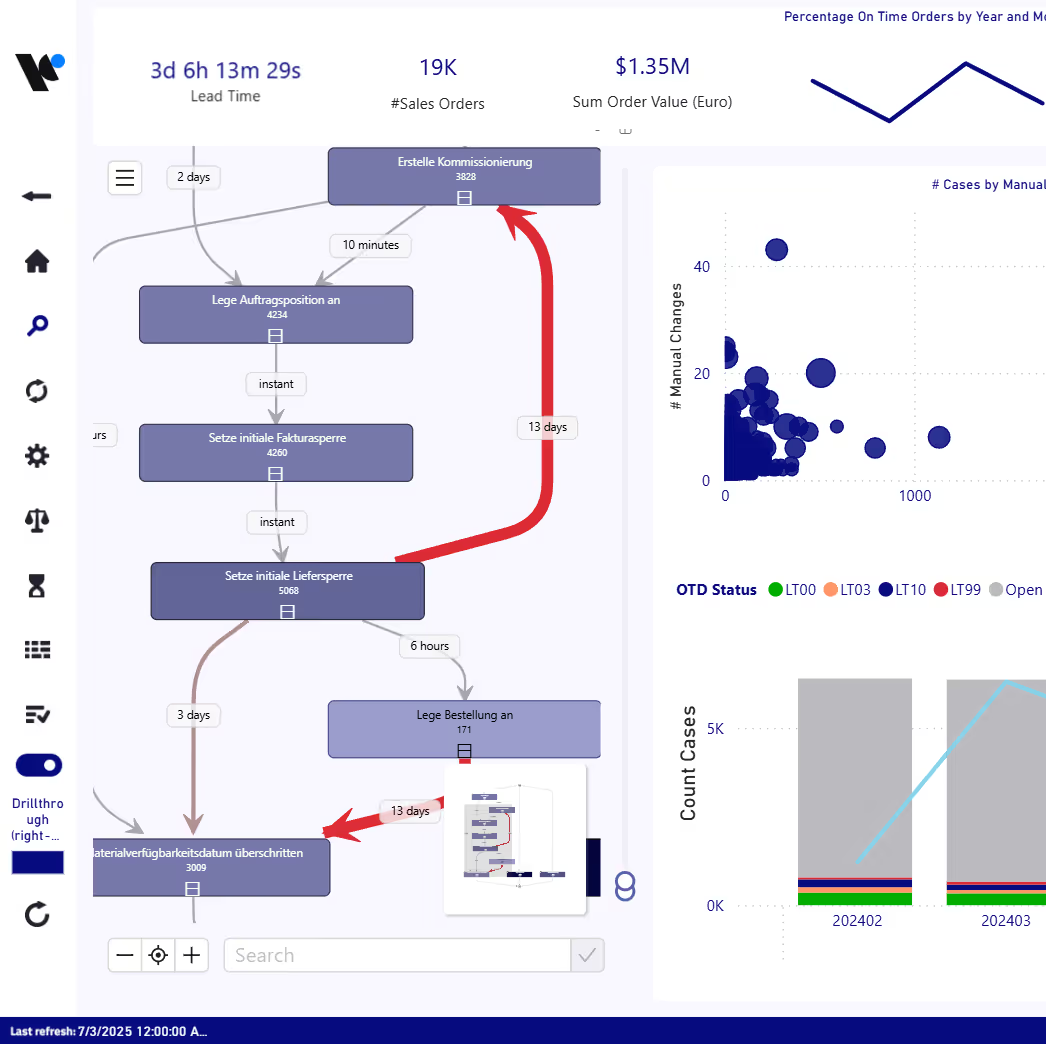
ps4qlk Process Analyzer Details Page for Qlik Sense.

From Shop Floor to Process Intelligence

Powered by our Data Preparation Tool (DPT), Process.Science connects to virtually any source system, from SAP PP / ERP systems to MES and SCADA, and turns the transaction data they already generate into process intelligence.
Native integrated in
SAP PP / ERP
MES Systems
SCADA
Custom & Legacy Systems

01. Data Extraction

We connect to your source systems. Every material booking, every BDE feedback and every machine status leaves a digital trace.

02. Event Log Generation

From millions of isolated raw data points, a seamless, chronological process flow (production order, station, timestamp) is generated.
Our USP

03. Flexible Integration

The process graph is calculated directly in Power BI, Microsoft Fabric or in our platform. No external cloud silo, no system break.

04. Actionable Insights

Interactive dashboards immediately show where throughput drops, rework occurs, or orders get stuck.
Security by Design

IP protection and data security come first. With Process.Science, the algorithm comes to your data. You maintain full data sovereignty within your own infrastructure.

Production data, work plans, and bills of materials are your company's most valuable intellectual property (IP). Unlike standalone solutions that move your sensitive MES data to external clouds, we turn the tables.

No data leakage

We integrate natively with your BI system. Your production data never leaves your firewalls.

Certified

Process.Science is ISO 27001 certified and develops software according to the highest German security standards.

Governance & Compliance

Continue using your existing user rights and approvals from Active Directory and Power BI with ease.

Proven industrial results

Analysts confirm that process mining customers in the enterprise segment achieve payback in just 6 months and a 383% ROI over three years. Real-world examples of our technology prove this:
Global technology corporation: Achieved 1.5 million additional on-time deliveries per year and drastically reduced manual interventions.
Leading chemical company: Improved first-time-right rate from 18% to 42% and increased on-time in full (OTIF) delivery to 90%.
Leading industrial equipment supplier: Reduced lead time of blocked orders by 40% and eliminated over 120,000 manual activities in the O2C process.

Why Process.Science?

Your advantages over expensive standalone solutions summarized at a glance.
100% flexible integration: native integration into Power BI or Microsoft Fabric, or run our platform on-premises for full flexibility.
Maximum data security: Your sensitive production and machine data never leave your IT infrastructure. We do not create external cloud silos.
Fastest time-to-value: Instead of years-long IT projects, we deliver initial reliable insights and dashboards within 4 weeks in the proof of concept.
Unbeatable TCO: Significantly lower licensing, implementation, and training costs (Total Cost of Ownership) than traditional process mining providers.
Any more questions?

Frequently Asked Questions from Production

The most important answers for plant managers, COOs, and IT.
Do we need new IoT sensors on our machines for this?

No. Process Mining primarily uses the digital traces that are already generated in your MES (Manufacturing Execution System) or ERP system (such as SAP PP). Every feedback from a work step, every material movement, and every transfer is enough to visualize the process in real time. No hardware upgrades are necessary.

We already measure our OEE. What added value does Process Mining offer?

A classic OEE measurement tells you that a machine is stopped or running too slowly. Process Mining tells you why. We link machine data with upstream logistics and order processes. This way, you can see if the machine is stopped because material is missing from the warehouse, a setup process was planned incorrectly, or there was a quality bottleneck in the previous step.

Can our complex, multi-level bills of materials (BOM) be mapped?

Yes. Modern Process Mining algorithms support so-called "Object-Centric Process Mining." This means we can map complex relationships: when 10 components become an assembly (convergence) or an order is split across three machines (divergence), our system represents this correctly and transparently.

Does Process Mining also work for batch size 1 or highly customized manufacturing?

Yes, even especially well. Especially in complex variant manufacturing or batch size 1, classic analysis methods (like time studies) lose track. Since we rely on the digital traces of each individual production order (Case ID), we reconstruct the exact sequence for each individual product and make specific bottlenecks and rework visible.

Are our machine data analyzed in true real-time?

This primarily depends on the configuration of your BI system and your source systems. In practice, we usually load the data in short, fixed cycles (e.g., hourly or every 15 minutes) into your Power BI or Qlik dashboard. This "near-real-time" setup is completely sufficient for dynamic shift control and bottleneck analysis, while also protecting the performance of your productive MES/ERP systems.
Transparency in 30 Days

Test Process.Science with your own data

Request our free one-pager. Learn how our Proof of Concept (PoC) works and how we identify bottlenecks and rework loops in your system in just 4 weeks.
Support from manufacturing specialists
Analysis directly in Power BI, Microsoft Fabric, or the Process.Science platform
100% GDPR-compliant and secure
By sending the request, you agree to Process.Science’s Privacy Policy
Thank you! Your submission has been received!
You will receive an E-Mail with a confirmation Link.
Oops! Something went wrong while submitting the form.