Process Performance Management

Clearly evaluate processes — with a single score

Overview page of the process performance management dashboard.
Details page of the process performance management dashboard.
Rework page of the process performance management dashboard.
Automation page of the process performance management dashboard.
Benchmark page of the process performance management dashboard.
Lead times page of the process performance management dashboard.
Cases viewer page of the process performance management dashboard.
Conformance page of the process performance management dashboard.
Introduction
Complex key performance indicators (KPIs) make it difficult to maintain an overview.
 Our scoring model shows at a glance how ‘healthy’ your processes really are — differentiated by perspective, product, factory or time period.
Convert KPIs into clear process scores — quickly, easily and without new IT infrastructure.
Process.Science Performance Management Dashboard with multiple bar charts.

How efficiently do your processes really run?

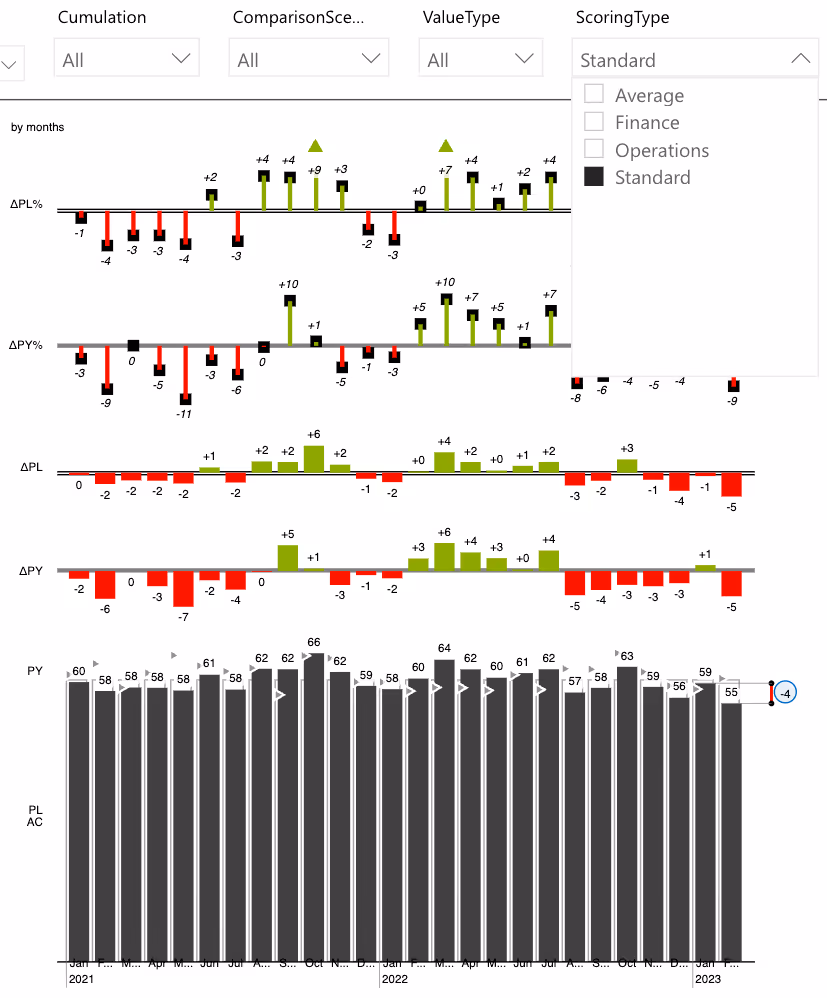
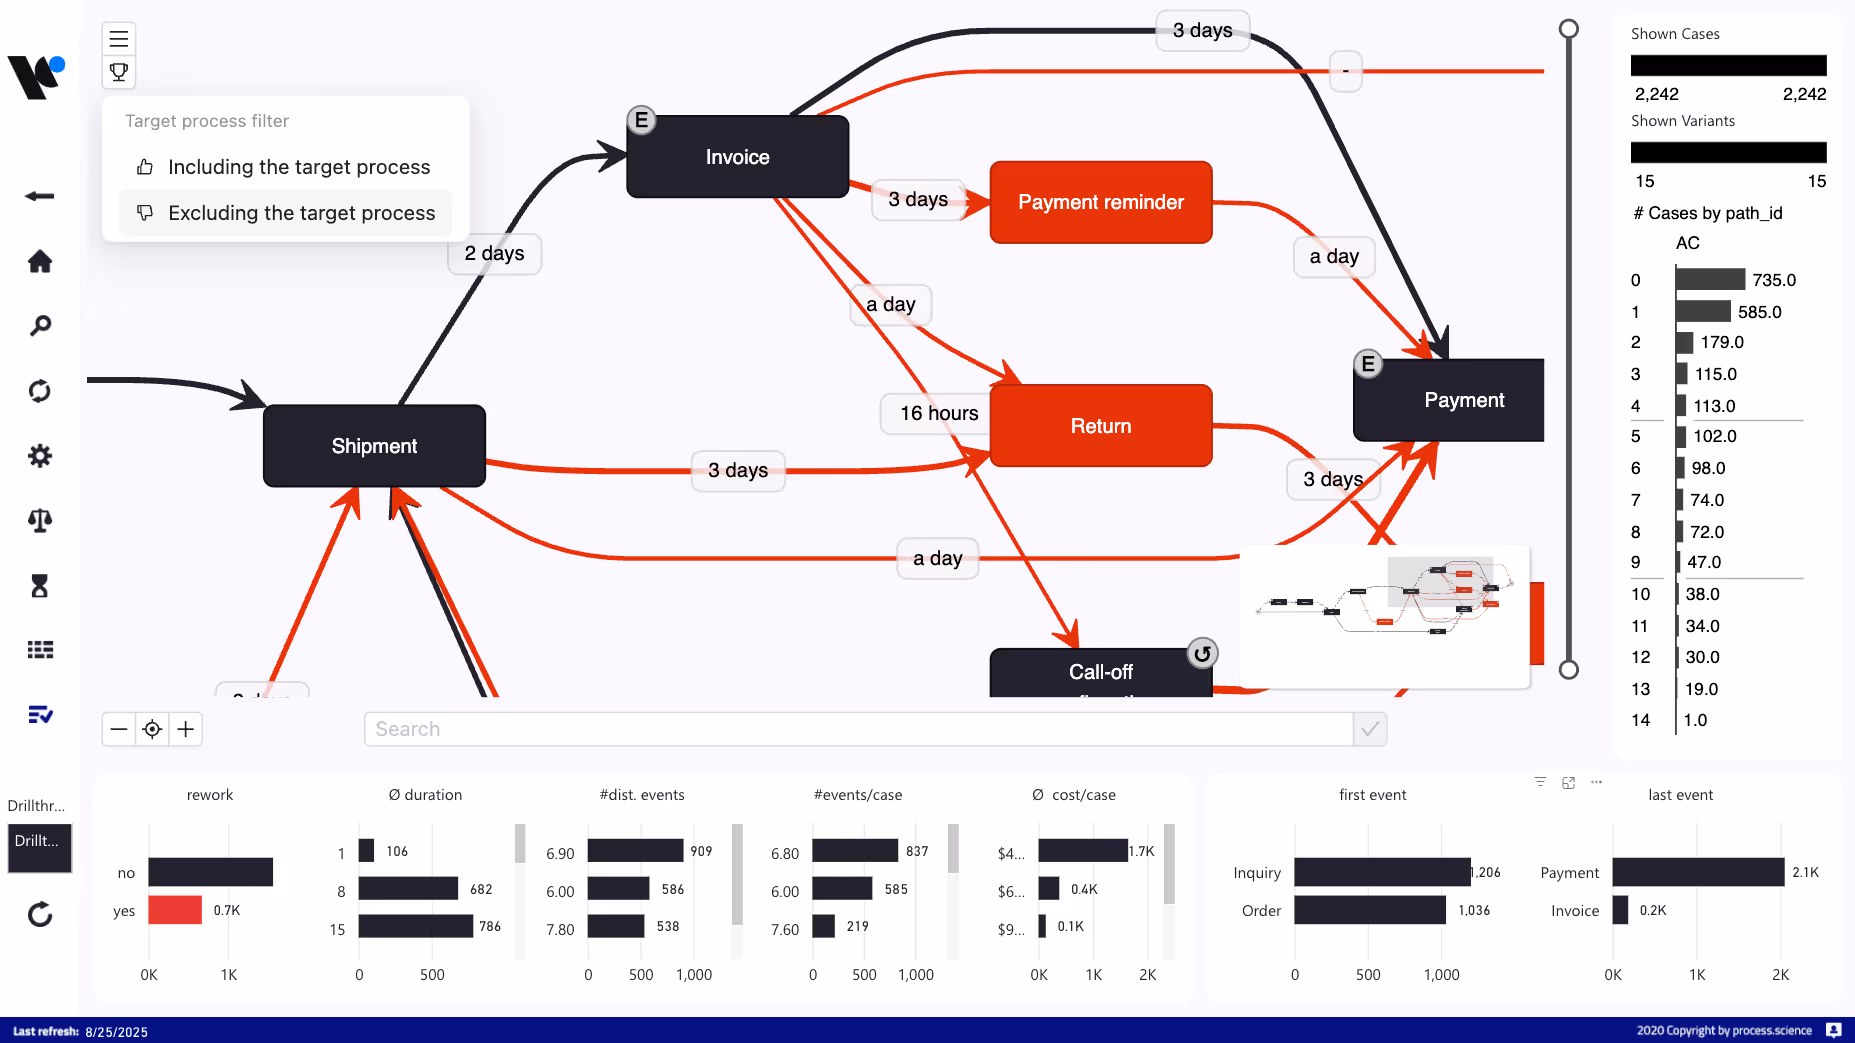
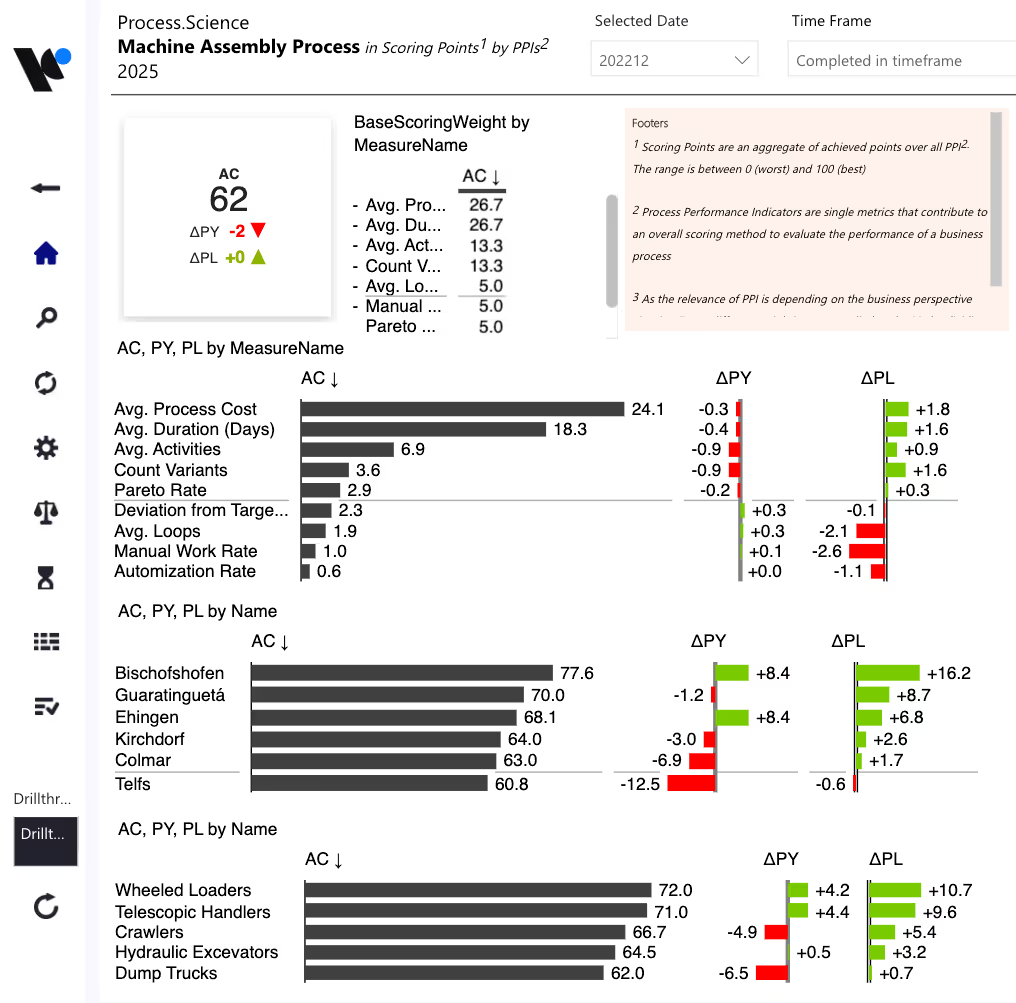
Lots of KPIs, but no clear picture? Our Process Health Score summarises complex data into a comprehensible key figure – differentiated according to relevant perspectives, it enables precise process evaluation.

  • A clear Process Health Score instead of confusing metrics.
  • Perspective-specific evaluation for finance, operations and standardisation.
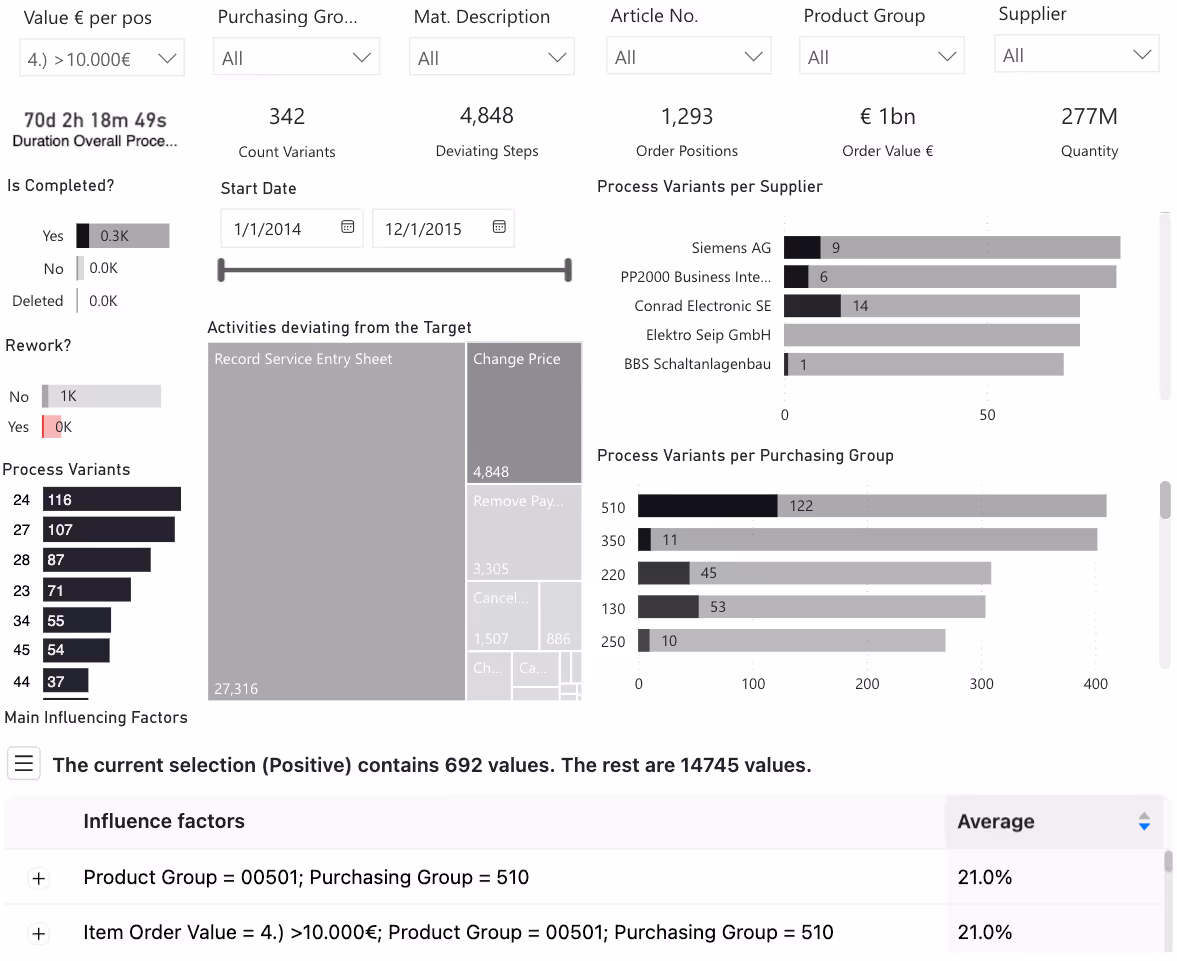
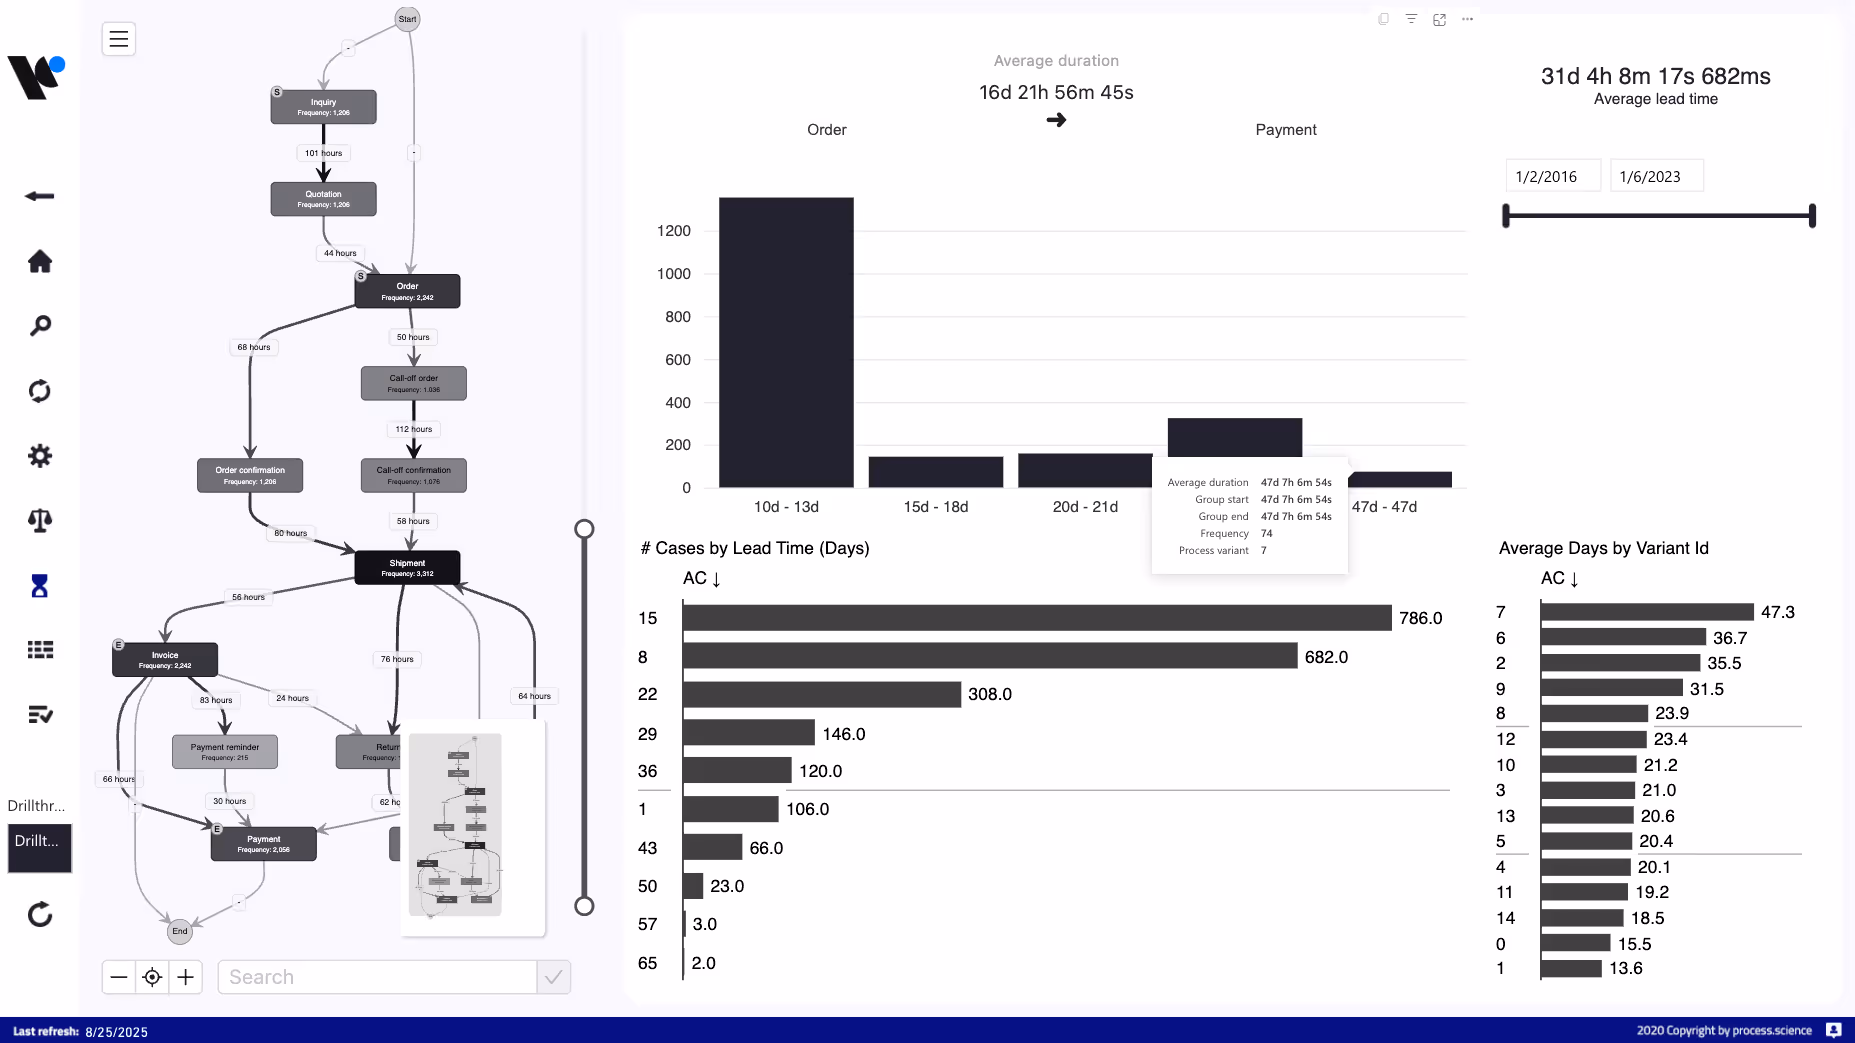
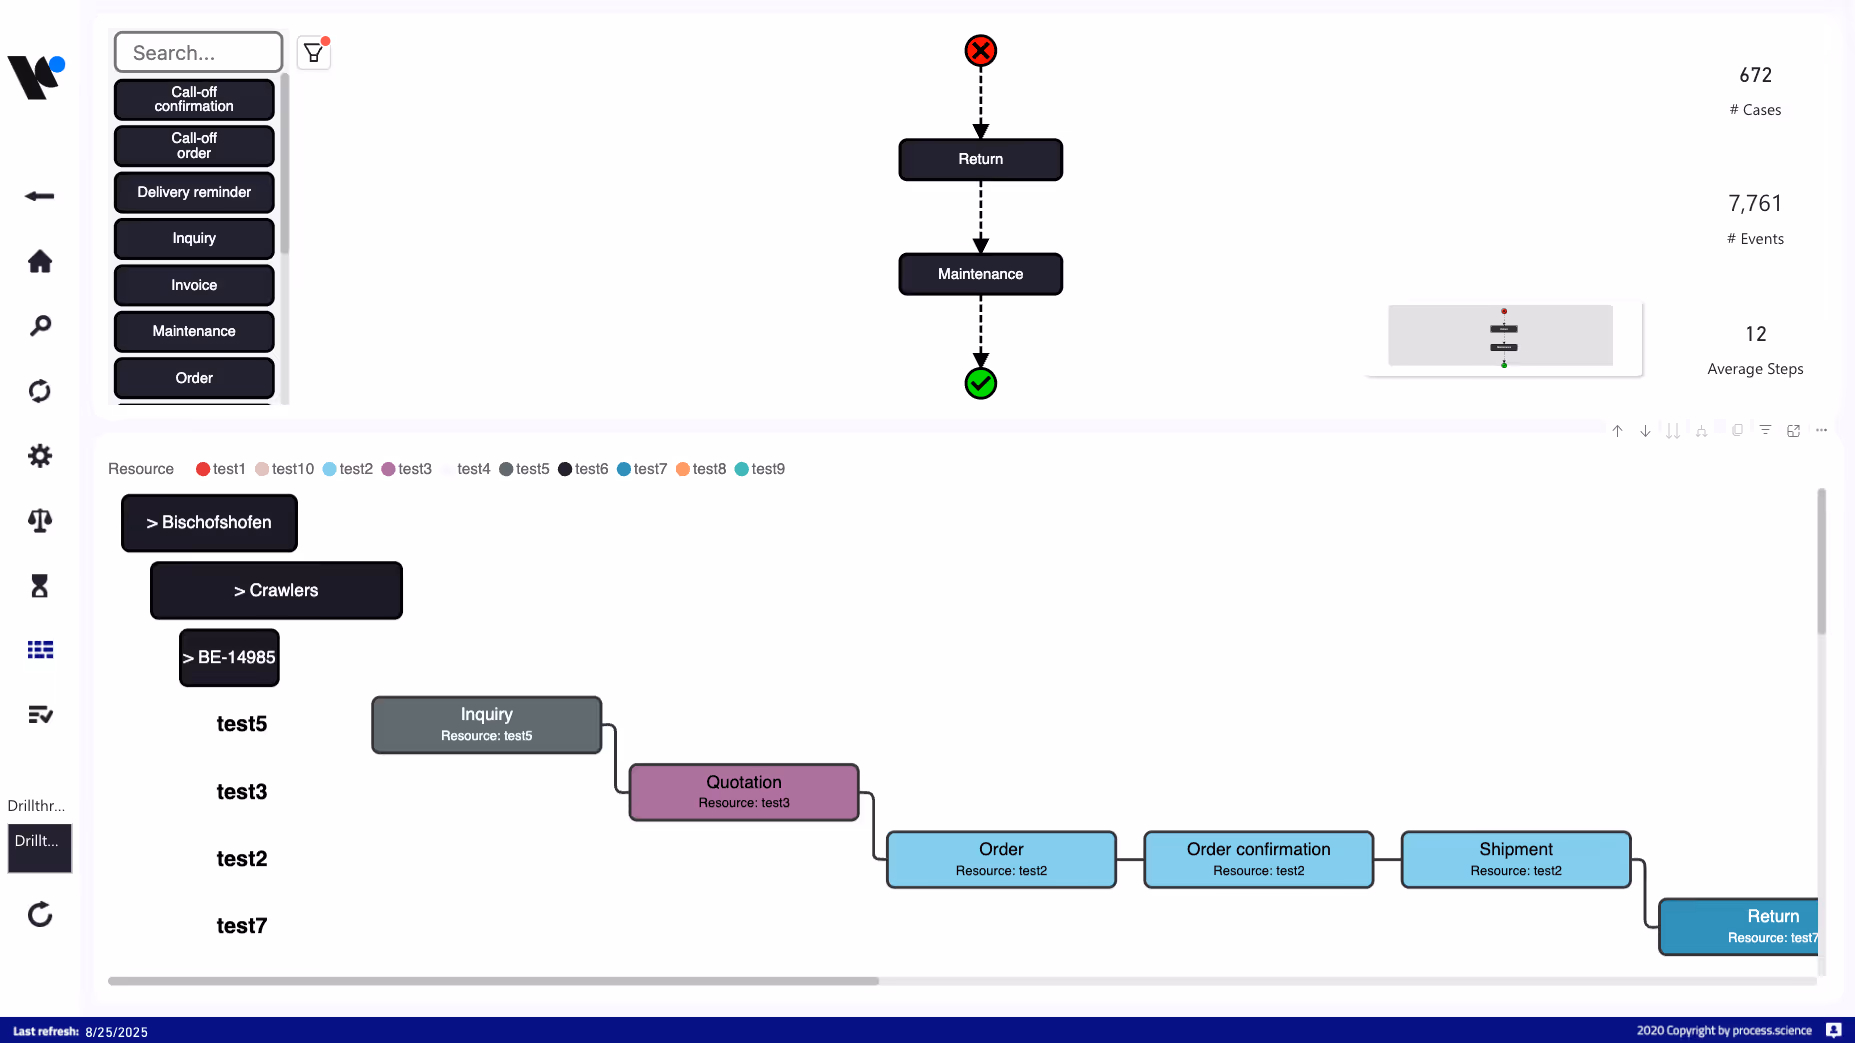
  • Automated weighting of relevant KPIs such as costs, throughput times, number, process steps and process variants.

Which perspective counts?

Finance, production and management – each of these departments has its own view of processes and priorities. Our model takes these differences into account and delivers a tailor-made evaluation value for each perspective – directly in your BI environment.

Finance department – focus on profitability

  • How can cash flow be improved?
  • Where are unnecessary costs being incurred?
  • Which processes contribute to profitability?
Our model provides key figures that reveal the financial impact of processes – for informed decisions in controlling and financial management.

Production department – focus on efficiency and stability

  • How smoothly do production processes run?
  • Where are there bottlenecks or delays?
  • How well are resources being utilised?
The process evaluation is based on operational key figures such as throughput times, utilisation or error rates – for continuous process optimisation.


Management – focus on the big picture

  • Which processes contribute to the corporate strategy?
  • Where are the risks or potential?
  • How are the most important performance indicators developing?
Our analysis provides a comprehensive view of the entire organisation – as a basis for strategic decisions.
Dashboard showing the different perspectives.
fast & easy

Start now with Process.Science!

Getting started with Process Mining is easier than you think. Thanks to seamless integration with existing BI systems such as Power BI or Qlik Sense, you can work with familiar tools. All you need for a quick “proof of value” is

  • Basic process data (event logs) from your systems, which our solution can extract
  • A business process as a starting point
  • 1-2 days for initial setup and first results

How can processes be compared — without IT effort?

Compare processes by product, plant, or time period with a uniform process evaluation — without any technical hurdles. Our solution uses your existing IT infrastructure and allows individual adjustments by specialist areas.

  • Uniform evaluation according to dimensions such as product, plant or time period
  • Use existing IT resources and business intelligence environments.
  • Self-service teams customise views and KPIs themselves
Process graph with purchasing KPIs.

Why wait when you can get started quickly?

Ready to go in just a few days – without new systems and with minimal training. Everything stays in your familiar BI environment.

  • Integration in 2–5 working days
  • Work in your familiar environment with extended functions
  • Reduced operating costs by eliminating separate platforms
Dashboard showing the detailed root causes of changes in the process.

What makes Process Performance Management unique?

Our innovative approach combines customisable dashboards, intelligent evaluation systems and industry-specific extensions, directly in your familiar BI environment and fully customisable.

  • Diverse analysis perspectives with flexibly weighted dashboards for targeted process evaluation
  • Automated process evaluations across multiple dimensions
  • IBCS-compliant visualisations seamlessly integrated into your BI solution
  • Extendable with process apps for purchasing, production and logistics
Part of the Process.Science Team: Babette, André & Lucas M.

How to get started

Would you like to learn more about the benefits and possible applications, or get started right away? Here are your next steps:

Arrange a demo now

See the solution in action in a customised presentation tailored to your requirements.

Participate in a webinar

Get a compact overview of features, use cases and best practices.

Start now

Schedule an appointment

Start analyzing and optimizing your processes today. Please contact us for an individual offer.

CONTACT