Process.Science Order Management

Cost reduction and process reliability through intelligent analysis

Process.Science Order Management Detailed View Dashboard with rework and Reliability Groups.
Overview page of the process performance management dashboard.
A Purchasing Process filtered with Changes in the process.
Showing two process graphs comparing the performance in 2014 with 2015.
Showing a table with details of all filtered purchase orders.
Showing details of a purchasing process in a swim lane chart.
Introduction
Keep an eye on your entire production with the process app for production/delivery reliability – while continuing to work within your existing BI environment, thanks to seamless integration.
Process.Science Order Management centrally combines order management, purchasing and manufacturing  - for efficient process optimization in production.

Identify production bottlenecks and take more targeted action with Process.Science Order Management

How to identify bottlenecks immediately:
A box in front of a calender displayed through a magnifying glass.

End-to-end transparency

You can see the entire production process – from order to delivery – in a linked process diagram
A magnifying glass in front of an icon with showing a person.

Responsibility mapping

The system shows you exactly where delays are occurring (e.g. purchasing, production, order management)
A magnifying glass in front of a funnel and a clock.

Bottleneck analysis

Bottlenecks are automatically detected based on throughput times, wait times, order capacity constraints
A check list with a magnifying glass the front.

Master data check

Incorrect or outdated master data (e.g. incorrect delivery dates, inaccurate parts lists) is highlighted. This avoids subsequent manual processing of orders in the ERP/stock control system
Process.Science Order Management Detailed View Dashboard with rework and Reliability Groups.

How to take targeted action thanks to process optimization in production

Targeted measures instead of „a scattergun“ approach

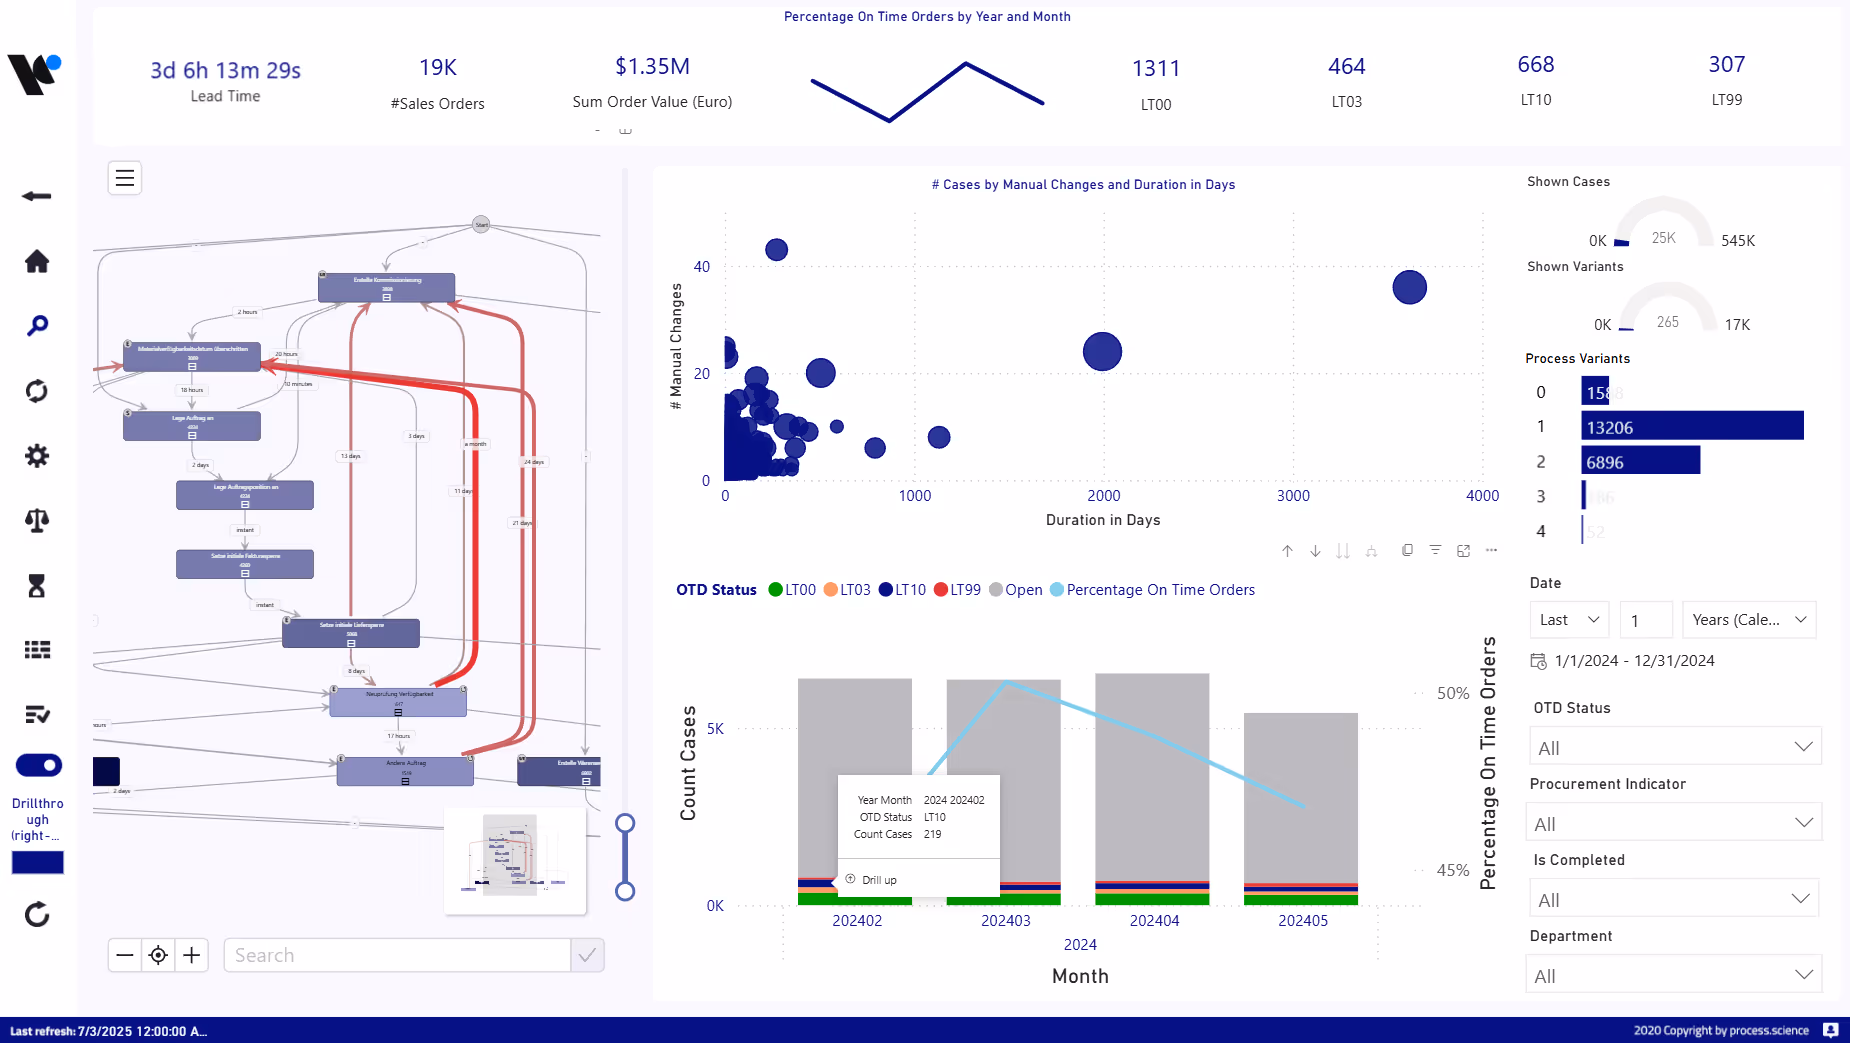
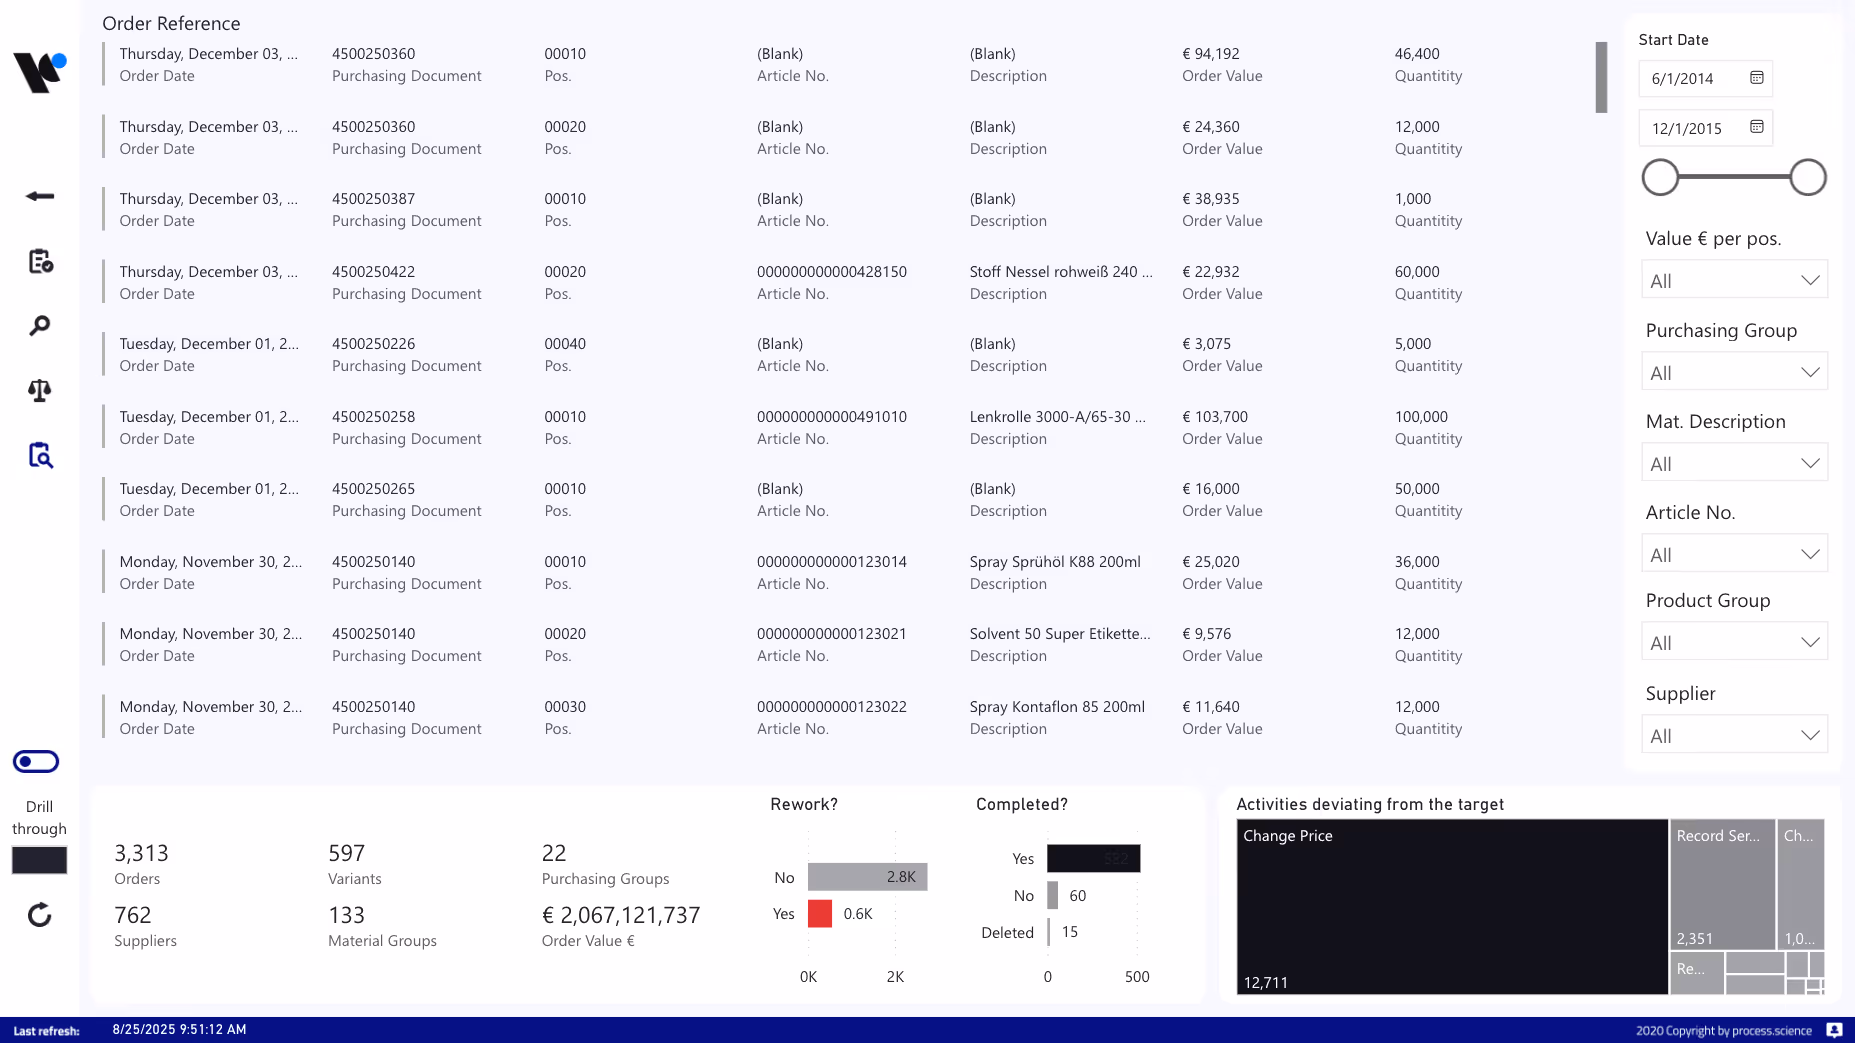
You know exactly where to start with process optimization in production — e.g. with a specific supplier, a machine or a process step.

Data-based decisions

You make decisions based on objective analyses, not gut feelings.
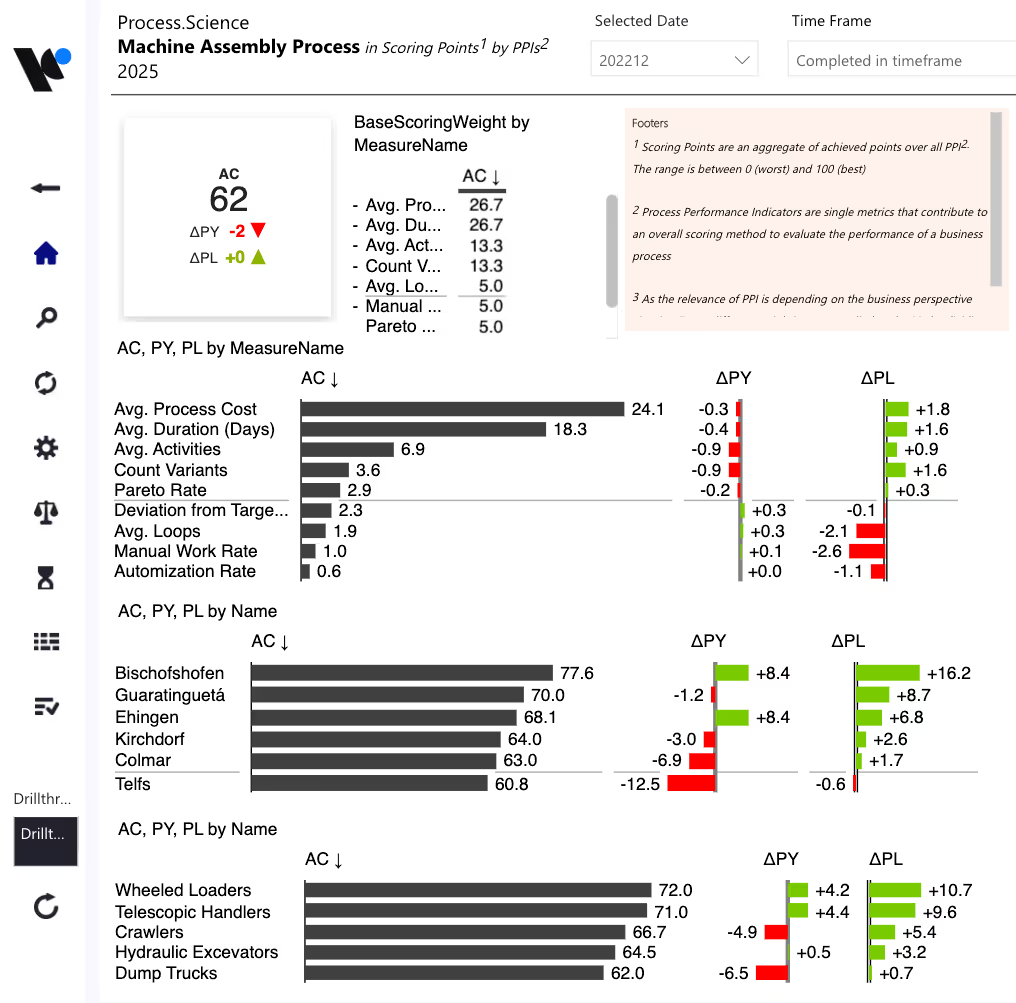
Customisable KPIs

You can define and configure KPIs relevant to your productions goals to monitor exactly what matters to you, as well as use existing dashboards and enrich them with Process.Science Order Management information.

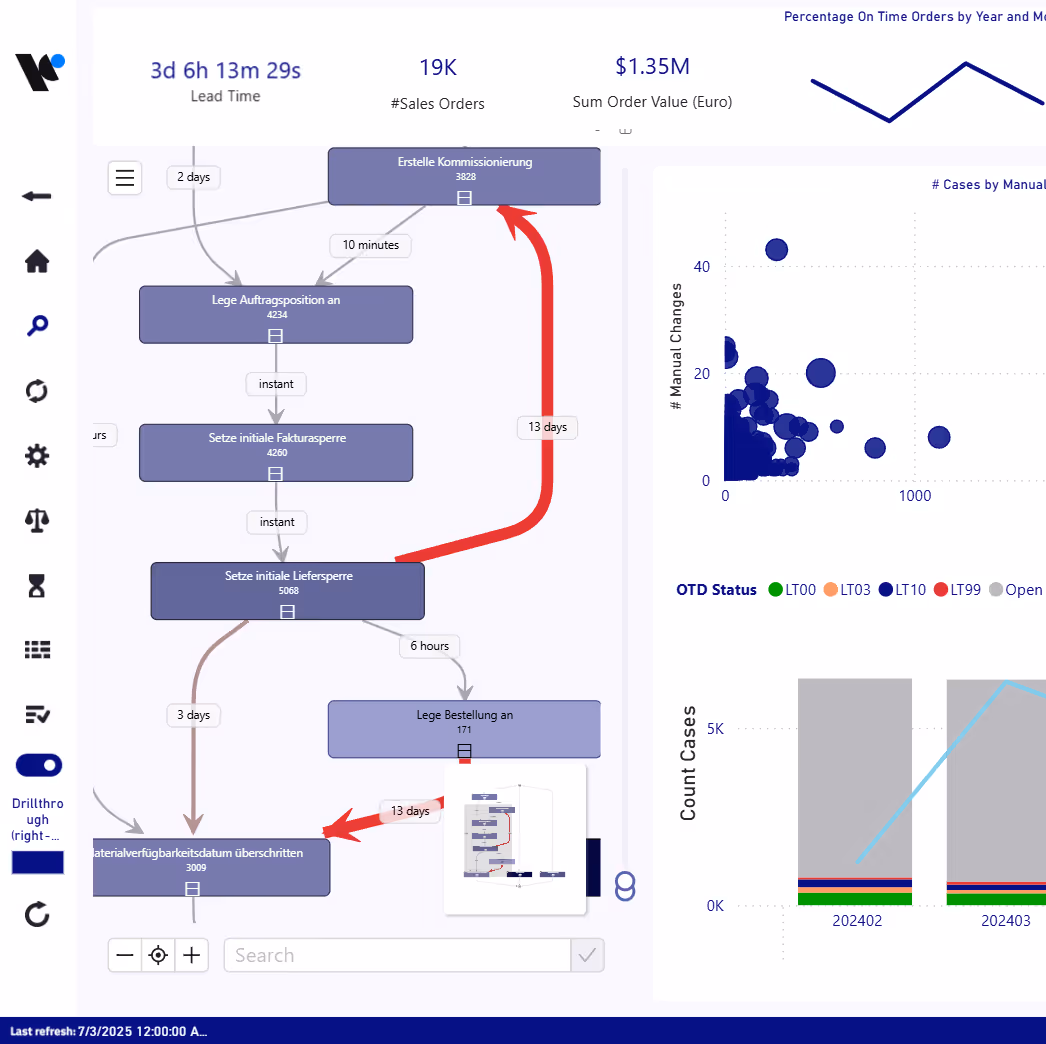
Integration into existing BI tools

All insights are available directly in your familiar environment — without having to switch systems.

fast & easy

Start now with Process.Science!

Getting started with Process Mining is easier than you think. Thanks to seamless integration with existing BI systems such as Power BI or Qlik Sense, you can work with familiar tools. All you need for a quick “proof of value” is

  • Basic process data (event logs) from your systems, which our solution can extract
  • A business process as a starting point
  • 1-2 days for initial setup and first results

What does Process.Science Order Management?

Achieve operational excellence with Process.Science

Process.Science provides customized solutions for process optimization in production and digital efficiency improvement – quickly, seamlessly, and without additional effort.

Seamless integration

  • Easy connection to your existing IT and BI landscape
  • No separate process mining platform required – works with your existing BI infrastructure.

Fast implementation

  • Ready to use in just 2–5 days
  • No major IT project

Intuitive

  • Work in a familiar environment
  • Advanced analytics with minimal training required.

Flexible

  • Configure KPIs and views yourself
  • No developer resources required

Costs

  • No separate process mining platform necessary
  • Reduced operating and licence costs
Process.Science Performance Management Dashboard with multiple bar charts.

How does Process.Science Order Management solve production challenges?

A box in front of a calender.

Responsibilities are clearly assigned

  • Root cause analysis for delays: purchasing, production, sales or QA
  • Detection of incorrect master data (e.g. unrealistic delivery dates)
A box with coins and a magnifying glass showing bars.

Hidden costs are identified

  • Analysis of waiting times, material waste and set-up times
  • Optimisation of production cycles for greater profitability
A magnifying glass in front of an icon with showing a person.

Quality is systematically improved

  • Early detection of recurring sources of error
  • Continuous improvement of product quality and customer satisfaction
Part of the Process.Science Team: Babette, André & Lucas M.

How to get started

Here are your next steps:

Arrange a demo now

See the solution in an individual presentation – tailored to your requirements.

Download the white paper

Get detailed insights into features, benefits and specific application examples.

Start now

Schedule an appointment

Start analyzing and optimizing your processes today. Please contact us for an individual offer.

CONTACT